Pre-Calc 11 Week #14
This week we learned about the difference between reciprocal function graph and absolute value graphs and how to graph each one.
For absolute value graphs it is graphs that reflect off the x axis/intercepts of the line to create a reflection of the parent function as in an absolute value equation we can’t get a negative, so in the graph we can’t go into the negative zone.
In a reciprocal function graph we focus on the invariant points in the parent function to create a new line that avoids the asymptotes on the x and y axis, y is usually 0 so it’s usually the x axis that we want to focus on. We use the middle of the invariant points to create the x asymptote.
Example of absolute value graph

Example of reciprocal function graph
Pre-Calc 11 Week # 13
This week we continues graphing linear/quadratic equations but this week practiced on finding the reciprocal of the equation and how it looks like when graphed.
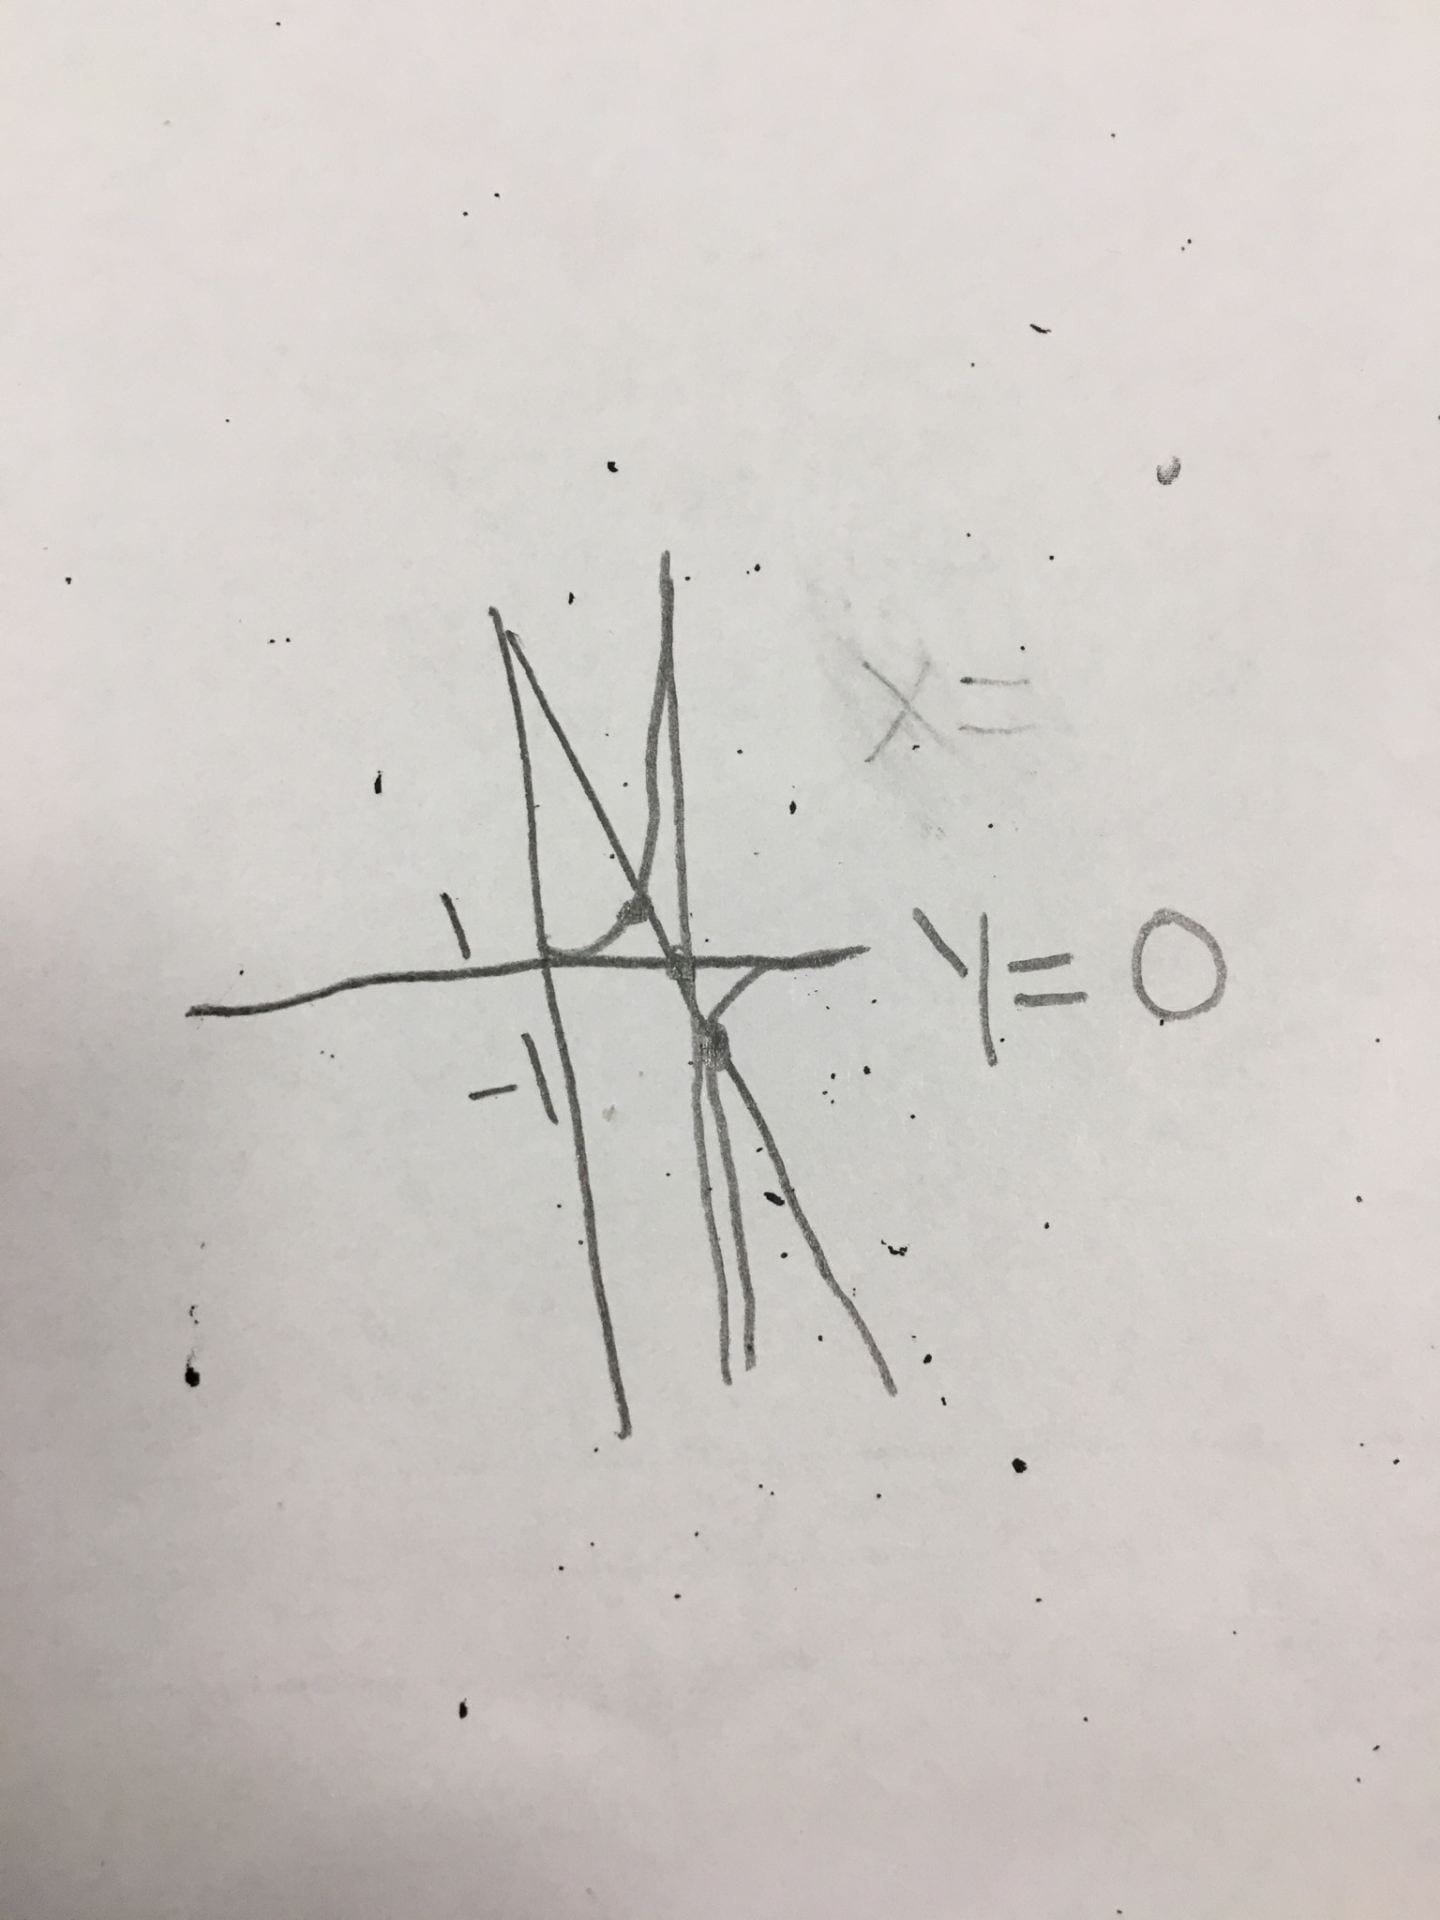
To find the reciprocal of the equation we first have to graph the parent function, then we find our invariant points by finding the x value that corresponds with y=1 and y=-1
With these x values we can draw our hyperbolas and answer what the x value is.
Ex
.
Pre-Calc 11 Week #12
This week we learned about graphing and solving absolute value graphs and equations, it’s similar to last chapter except with absolute value signs so the graph can’t go into the negative and is all positive. In this way it basically reflects the same way as it was going as in into the negative but in the other direction once it hits y=0.
Because of this the graphs end up looking something like this based on the type of equation (linear/quadratic)
![]()
![]()

Other than graphing we can find the x values by using previously used ways of solving for quadratic/linear equations, for quadratic specifically we’d be making one side and getting it to 0 before using the quadratic equation or factoring to get our x values.
Pre-Calc 11 Week #11
This week we learned about graphing inequalities in two variables. It’s similar to how we did it in chapter 4, but we must find out what side of the parabola is used for the answers of the side by replacing x and y with numbers that aren’t on the line, (0,0) is the easiest to use in most cases so we usually use that to replace x and y.
In this example I show how to use this technique by replacing x and y with (0,0)

Pre-Calc 11 Week #10
We focused on studying for our midterm this week. To prepare for it, I spent my time rewriting most of my notes as to remember what we learned and how to do everything along with going over the reviews and practice tests in the textbook of each unit and doing the cumulative review. Doing this will help my mind refresh on all that I’ve learned throughout the semester along with questions that may be on the test as the reviews have the main ideas of each unit in them which are usually shown in the tests. Hopefully, this studying will aid me in getting a good mark on the midterm.
Pre-Calc Week #9
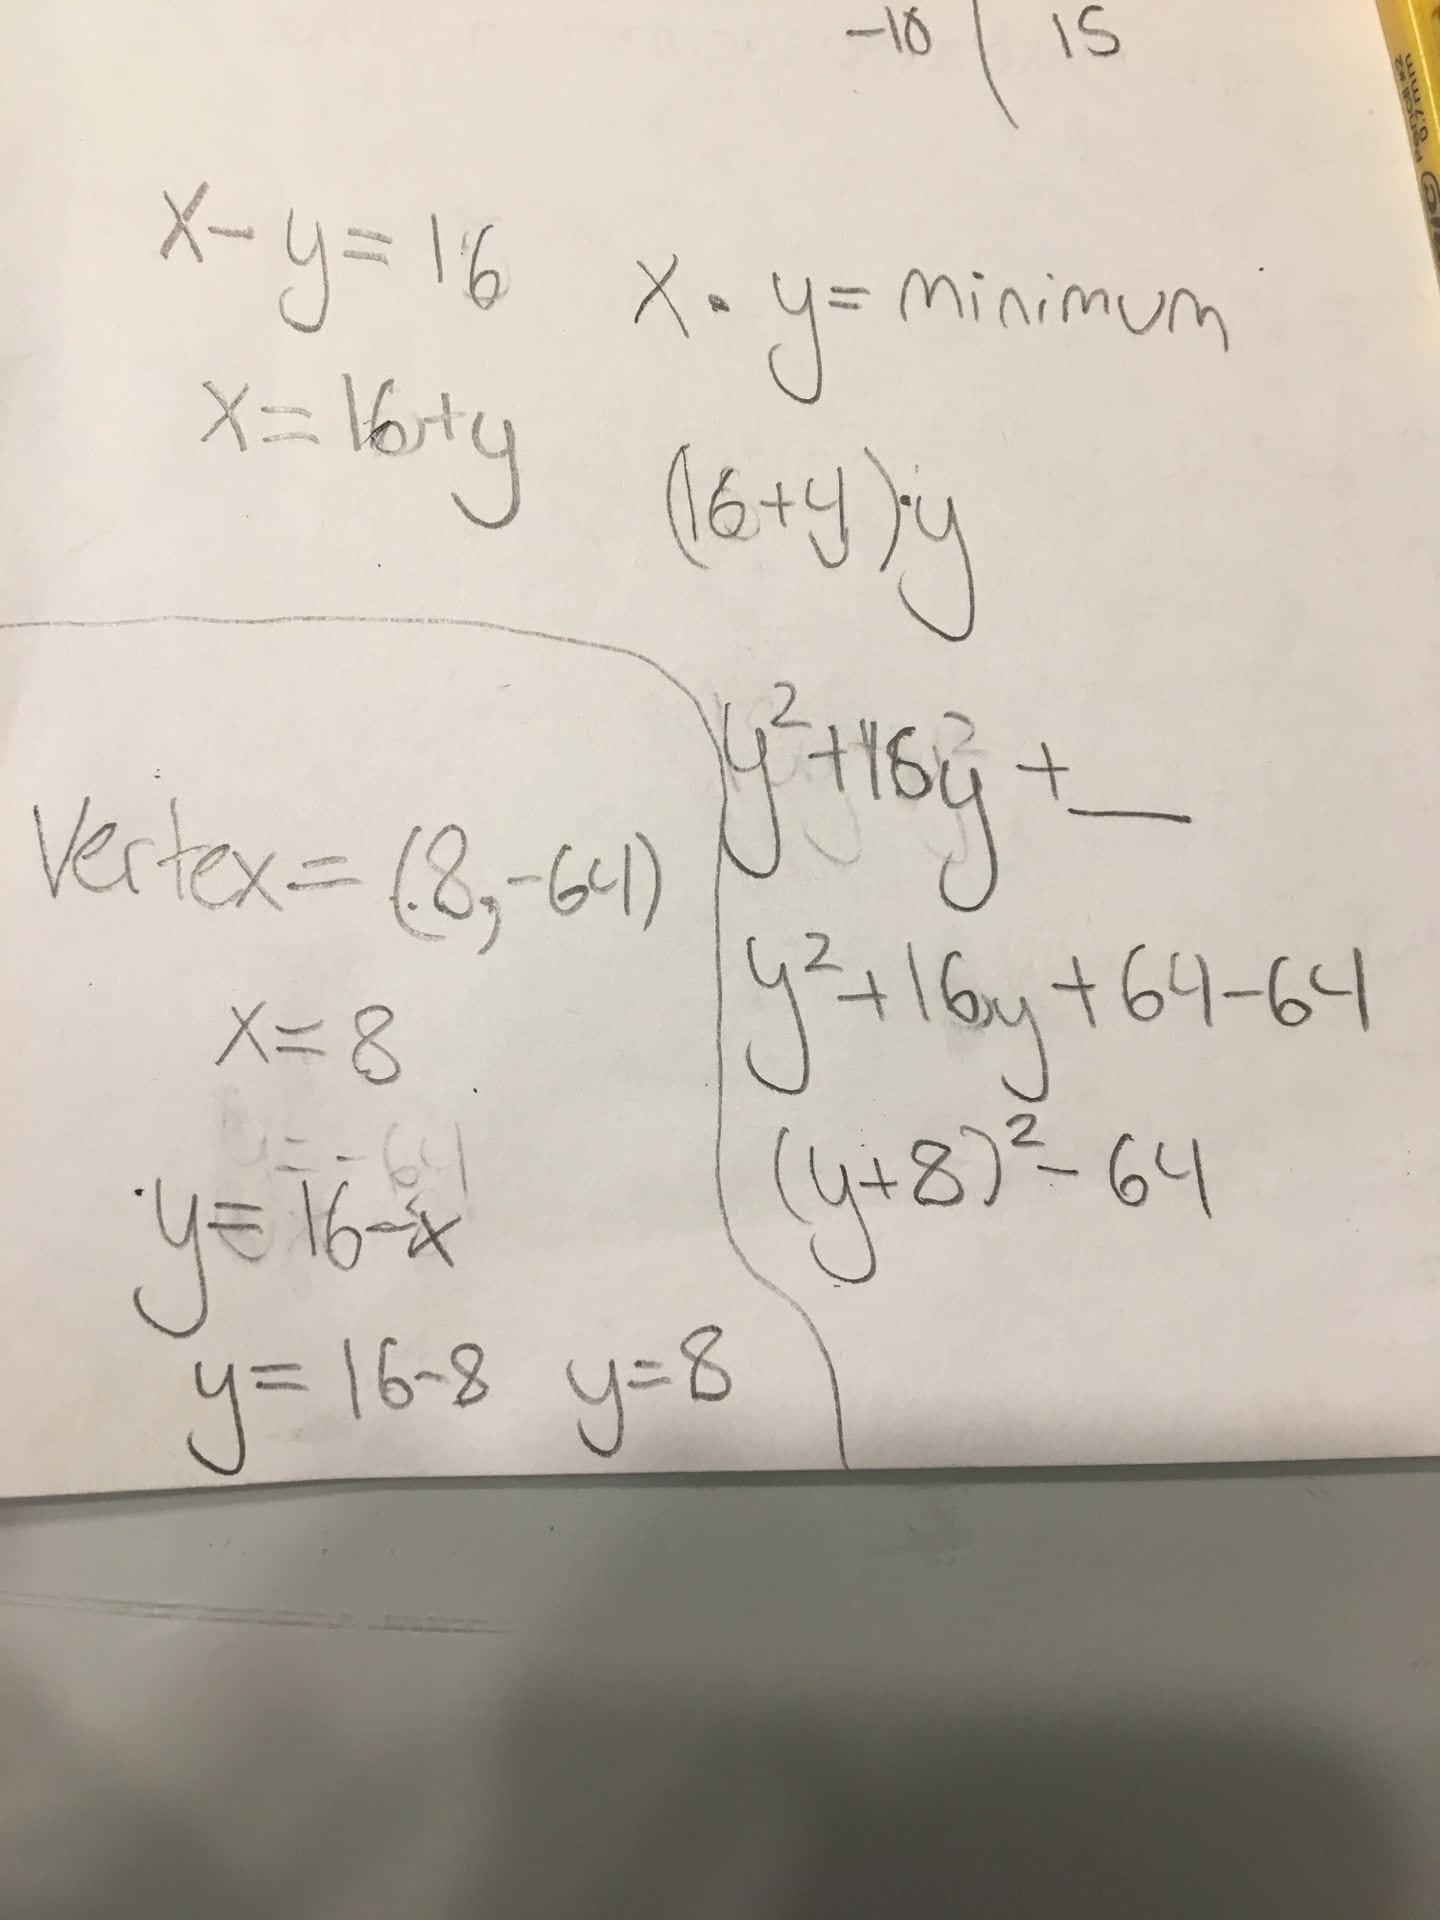
This week we learned how to do word problems with quadratic functions, like finding the maximum area of a certain amount of fencing or finding two integers with a sum or difference that have a minimum or maximum and find the answer to the maximum area or finding the two integers.
An example of how to find the integers is by taking, for example, x-y=15 and x*y=minimum and isolating one of the variables and using the substitution technique of turning it into x=y+16 and then replacing x in the multiplication with y+16 and solving before using the difference of squares to turn it into a quadratic and get an answer
Ex
.
Pre-Calc 11 Week #8
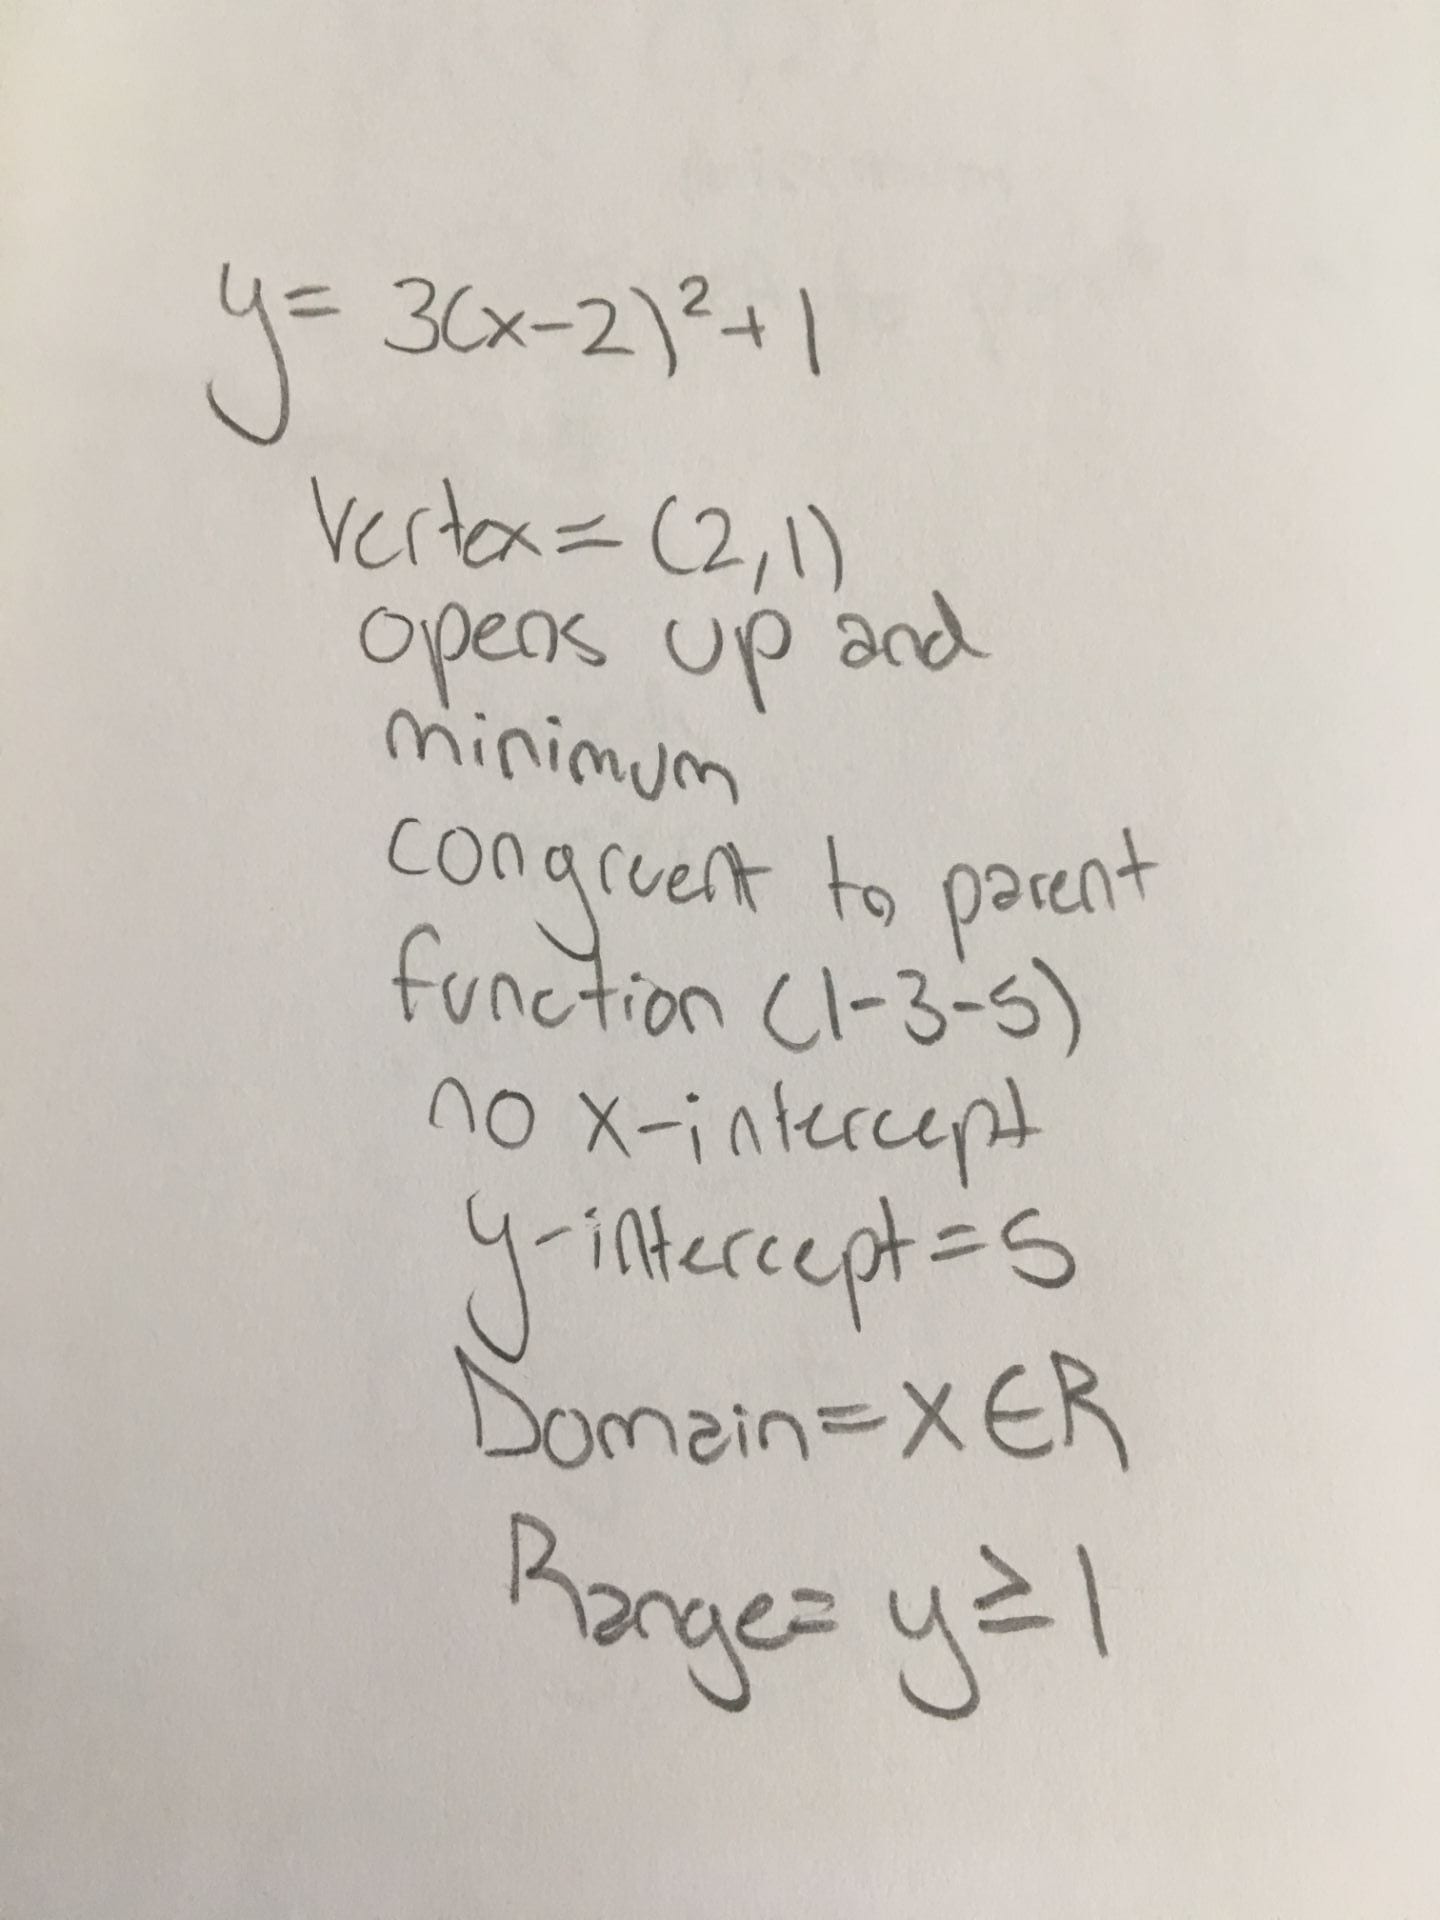
This week in pre-calc we learned how to analyzing quadratic functions in the form of graphs using the equation
^2+q")
The vertex is found easily with this as the p variable is what ends up being the x value and the q variable being the y value in the vertex.
With the vertex we can then find the axis of symmetry.
With the coefficient of x (a being the variable of whatever the coefficient is) we can figure out if its maximum or minimum vertex if it’s negative or positive, if minimum it opens upward and if maximum it opens downwards. Using the information of the equation we can figure out what its congruent to as well as the rest of the information needed such as x/y intercepts and domain and range