~What is a linear relation?
A linear relation is mathematical relation between numbers and graphs. If something is a linear relation it can be graphed or put into an equation using variables. Commonly x and y. There are multiple examples of a linear relation. The first example is in a pattern. If a pattern is linear, it goes up by the same number for the whole pattern. If it isn’t linear, that means that the pattern doesn’t have to be going up by the same number. 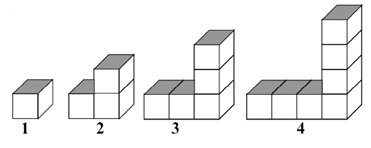
This is an example of a linear pattern. As you can see, the cubes are going up by the same amount each time. A nonlinear pattern is a pattern that doesn’t have to be going up or down by the same amount. It can go up by different numbers each time. Here is an example of a nonlinear pattern.
 As you can see, in the pattern, the number it’s going up by isn’t the same.
~How to Find the Rule for a Linear Pattern
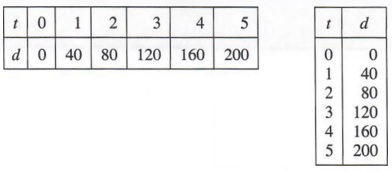
In this example we have a table of values, which is also known as a t-chart. On one side we have a header that has the letter t and on the bottom of it, there are numbers. On the right side, we have a header that has the letter d on it. Under the d there are also numbers. In finding a linear pattern, our goal is to try to get the t side in this case equal the d side. On order to figure that out, we need to know how much the numbers are increasing by on the d side. In this case its increasing by forty. This means the first part of our answer will be 40t because whatever number is on the t side has to be multiplied by forty. Let’s see if our pattern rule works. If we multiply zero by forty we will get zero. Look, it says zero on the d side. This means so far, our pattern is correct because it equaled the same number on the d side. Let’s try the second number to make sure our pattern is correct. If we multiply one by forty we get forty. Since it was equal to forty and matched the number on the d side, this means our pattern is correct making the answer, t=40. The main objective is to figure out in this case what t is. To find out if your pattern is right you should check the first two or three numbers. If they all match that means your pattern rule is correct. If it doesn’t match at all or one of them match but the other ones don’t, this means your pattern rule is incorrect. In some patterns, when you figure out how much the right side is going up by and multiply it on the left side, it’s not always going to equal whatever number is on the right side. You either have to add by a number or subtract by a number. This brings me to my next topic.
~How can you determine whether a pattern is increasing or decreasing?
In order to determine if a pattern is decreasing we need to look at the right side of the table of values. In the last example, the pattern was increasing because the number that associates with the x determines if the pattern is increasing or decreasing. 
This is an example of a decreasing pattern. For the first three coordinates, we see that both sides are being decreased but what matters is the right side because that’s the side on which we can determine if the pattern is increasing or decreasing. Just be looking at it we all ready know its a decreasing pattern because its going down by three each time. The start of the pattern rule is -3x and just from knowing that piece of information, we can figure out of the pattern is increasing or decreasing. As I said, it all comes down to weather the number associated is positive or negative.
~What is a t-chart and How do you fill it?
A t-chart as I used in the examples before is how linear patterns are figured out and how people are able to plot points on a graph through the variables x and y.

This is an example of a t-chart as we know but how do you fill it? There are multiple ways to fill a t-chart. One way is using coordinates off a graph.
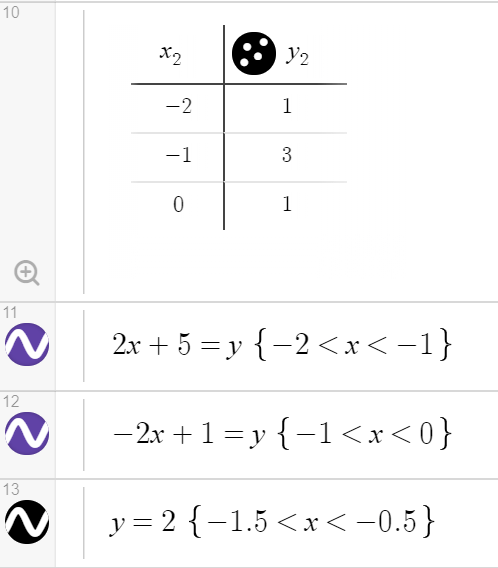
If we use the second dot as an example the coordinates are (2,1) A t-chart is formatted the same way as the way I formated the coordinates here. The x coordinate is always first in the t-chart and the y is always on the right. This is easier because since both of the coordinates are formatted the same, it’s easier to find the pattern rule and graph it. So using the coordinates, (2,1) we put the two on the x side and the one on the right side where the y is. Now the t-chart is setup so that we are able to use it as a graph to plot points, or to figure out a pattern rule. This is an example of why t-charts are vital to linear relations.
~How do you plot a coordinate and how do you graph a linear relation?
Plotting points on a graph are very simple if done properly.

As you can see, above we have a graph and a t-chart. In order to plot a point on a graph we need a graph and coordinates so they can be plotted on the graph. As I said in the last section t-charts are very helpful because not only are the coordinates in order, but they are also properly formatted. Let’s use the third example on the t-chart to plot our points. The coordinates are (3,3). The first thing to remember before plotting points on a graph is to remember what the x and y-axis are and how to use them properly. The reason why x comes before y is because when plotting points, we always start with the x point and we line it up with the y point. Now that we know how to plot a point, let’s try it! So, we take the first coordinate which is three and we know its positive so it’s going to be on the right side. Its right in the middle of the two and four so we put our finger there. Then we also know that the other three is positive so it’s going to be going upwards. Then we use our finger and we see where the two points meet.

Now as you can see, there is the coordinate, (3,3) beside other coordinates. That’s how you can plot points on a graph. Quite simple isn’t it! Graphing linear relations is the exactly the same thing when plotting a point except you use the t-chart and plot your points. There is also another form of graphing linear relations. Let’s use the same t-chart we used as an example.
As I mentioned before, in order to find out the graph the linear relation, we need to find the pattern. Using the information from the previous sections, we can determine the pattern of this t-chart is y=x. Now with this rule, we known exactly where the coordinates should be lined up. Here is an example of our pattern rule being tested in desmos.

As we can see, because we figured out the pattern rule, it’s easier to plot the points because we know what direction they will be going and it’s easier to plot them.
~How do you graph vertical and horizontal lines? How do you determine their equations?

Let’s start with vertical lines. In the graph above, the vertical line is red and the horizontal line is blue. In order to graph either a vertical or horizontal line, you need to have a location or coordinate to plot on the graph. For the vertical line, I chose x=2 as an example. Once I put it in the message space, the line went straight up. For the horizontal line, I put y=4 and it went sideways making a straight horizontal line. Graphing them is very easy. All you need to do is either put x equals a number, or y equals a number. Then the line will go either straight vertically or horizontally. Now that we know how to graph the points, how do we figure out the equations?
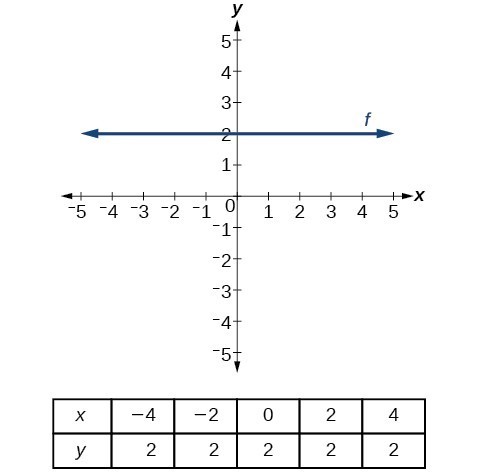
In this example, we have a t-chart that has different numbers on the x side but the same numbers on the y side. Determining the equation for both the x and y axis are very simple. All we need to do is look at whatever side has the same numbers and say x or y equals the number that is repeating. In this case it would be y=2 so as you can see above the line is going across the y axis and it’s on the 2. That’s how you can determine equations and how to graph vertical and horizontal lines!
~Vocabulary:
X and Y Axis: A coordinate grid has two perpendicular lines, or axes, labeled like number lines. The horizontal axis is called the x–axis. The vertical axis is called the y–axis. The point where the x–axis and y–axis intersect is called the origin.
T-chart: A T–chart is an organizational tool to help solve equations. This is one way to help solve equations with variables, which are any unknowns in an equation or formula. A T–chart can be set up like this: Each side represents a variable, or unknown.
Coordinate: In geometry, a coordinate system is a system that uses one or more numbers, or coordinates, to uniquely determine the position of the points or other geometric elements on a manifold such as Euclidean space.
Quadrants 1-4: The axes of a two-dimensional Cartesian system divide the plane into four infinite regions, called quadrants, each bounded by two half-axes. These are often numbered from 1st to 4th and denoted by Roman numerals.
Origin: On the flat coordinate plane, there are two axes, the vertical y-axis and the horizontal x-axis. The origin is the point where they intersect. This point has the coordinates 0,0 and is usually labelled with the letter O.
Plotting: Plotting is to place a point on a coordinate plane by using X and Y coordinates.
Linear Pattern: Linear Patterns. If the plotted points make a pattern, then the coordinates of each point may have the same relationship between the x and y values. In such a case, the x and y values are connected by a certain rule. A linear pattern is said to exist when the points examined form a straight line.
Increasing Pattern: Increasing patterns are patterns in which one or more elements of the sequence or arrangement increases.
Decreasing Pattern: A decreasing pattern is a shrinking pattern that decreases by a constant amount each time.
Horizontal Line: A horizontal line is one which runs left-to-right across the page. In geometry, a horizontal line is one which runs from left to right across the page. It comes from the word ‘horizon’, in the sense that horizontal lines are parallel to the horizon.
Vertical Line: A vertical line is one the goes straight up and down, parallel to the y-axis of the coordinate plane. All points on the line will have the same x-coordinate. In the figure above, drag either point and note that the line is vertical when they both have the same x-coordinate. A vertical line has no slope.
Bonus:
Something that I learned that wasn’t mentioned is when you are graphing and you need to switch the line into the opposite direction, all you need to do is switch the variable by making it negative and it switches directions. This helped because instead of finding a new equation.
Desmos Picture:


Sources:
https://nsmathematics.weebly.com/mt9-linear-
relations.htmlhttps://www.pinterest.ca/pin/145522631681502942/https://quickmath.com/
webMathematica3/quickmath/graphs/equations/basic.jsphttps://nebulaapps.com/writing-linear-equations-from-
tables/https://quickmath.com/webMathematica3/quickmath/graphs/equations/basic.jsp
https://magoosh.com/praxis/praxis-math/praxis-math-practice/praxis-core-math-linear-equation-practice-
questions/https://mathbitsnotebook.com/Algebra1/LinearEquations/LENewGraphPractice.htmlhttps://mathbits.com/MathBits/StudentResources/GraphPaper/GraphPaper.
htmhttps://magoosh.com/praxis/praxis-math/praxis-math-practice/praxis-core-math-linear-equation-practice-questions/
Core Competency Reflection:
https://sd43bcca-my.sharepoint.com/:w:/g/personal/132-dgilaev_sd43_bc_ca/ESWNVXGVX0dPsdBZDrewWSABi1kzWrEoauaDnRkYihpVqA?e=4%3ArFab35&at=9