This past week we started unit 5: Graphing Inequalities and Systems of Equations. Something I learned this week is how to graph inequalities. Here is an example of graphing an inequality on a graph:
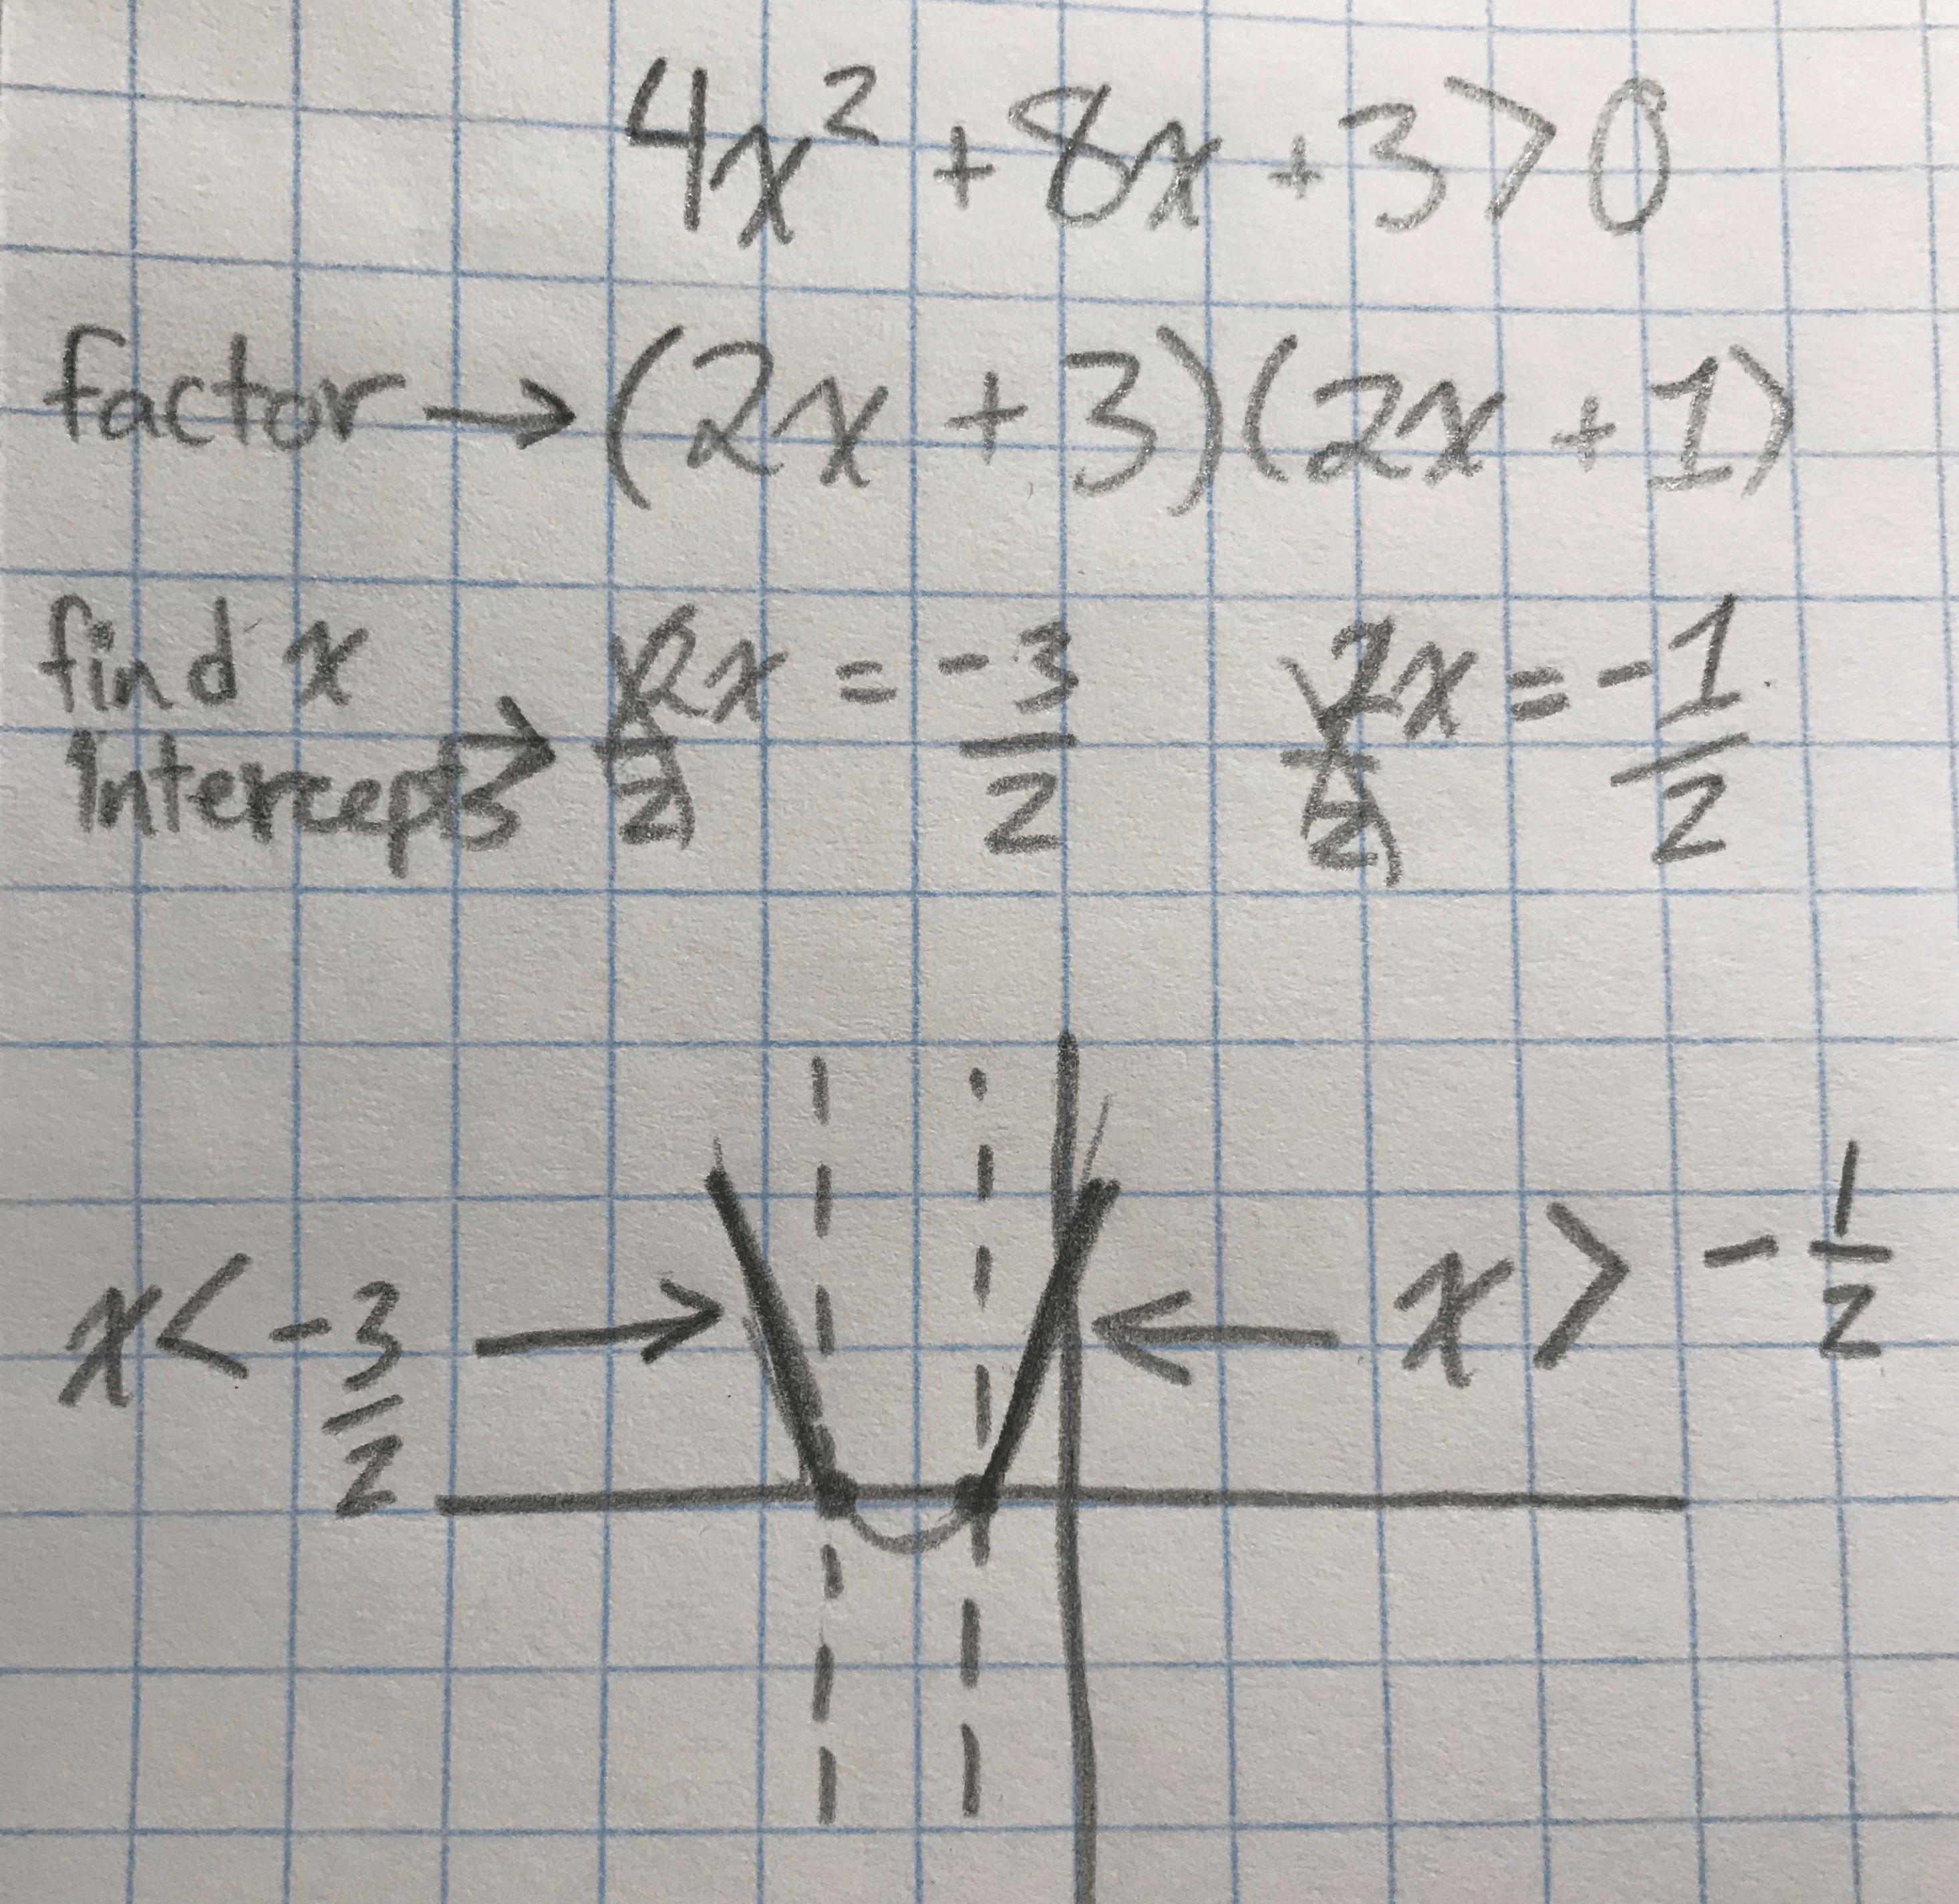
- The parabola is facing up because 4x^2 is positive
- The equation is > 0 so if its larger it is talking about the part of the parabola that is above the x-axis (shaded in dark on drawing)