In my math class, we are studying how statistics can be misleading. We were assigned to find a current day headline, graph, media story that uses statistics in a misleading manner and explain why it is misleading.
This one has the correct figures, but that big headline makes you think that 5.3% of children get spinal cord injuries making it very fear based on parents.
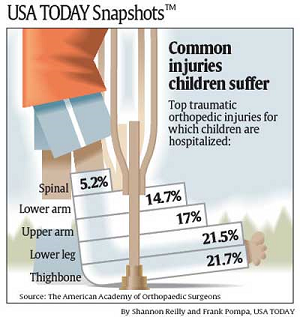
The real figure is about .0000003% (based on 2000 injuries per year out of a population of around 74,000,000.
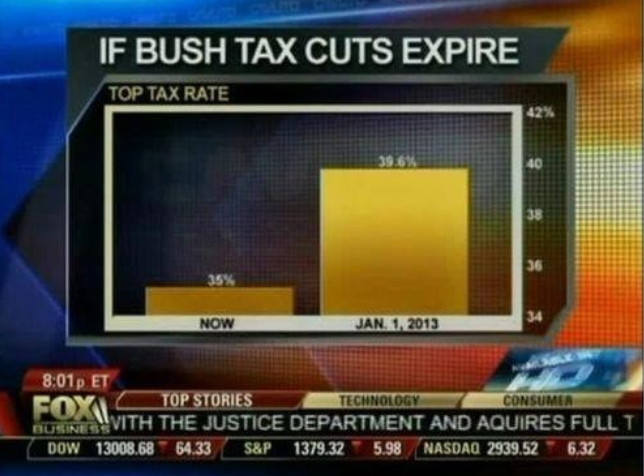
Fox News Misleading Graphs.
Fox News showed this chart of what would happen if the Bush tax cuts expired. The scale starts at 34 to make the stats look way larger than they actually are.
Misleading Statistics Examples in Advertising.
80% of dentists will recommend everything.
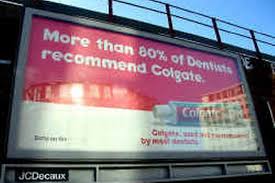
Image: Manchester Evening News.
Colgate ’s claim that 80% of dentists recommended the brand. Consumers were led to believe that 80% of dentists recommended Colgate while 20% recommended other brands. It turns out that when dentists were surveyed, they could choose several brands — not just one. So other brands could be just as popular as Colgate. This completely misleading statistic was banned by the Advertising Standards Authority.