From grade 9, we learn that x is our input number and y is our output number. In grade 10, we build on that. This week, I learned two new terms that are very useful for this unit. The first one is domain and the second is range.
The domain of a graph are all the numbers that can be used for x in an equation. In a graph like this,
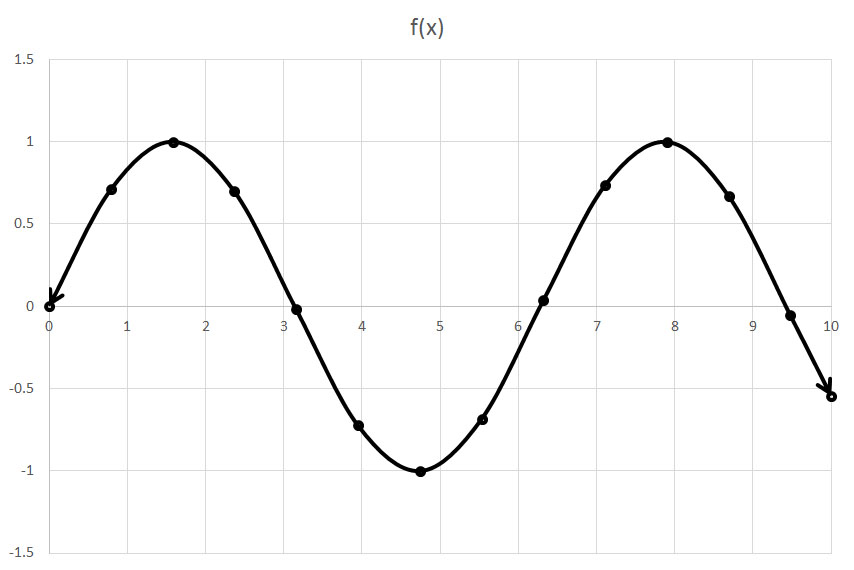
You would write your domain like this: D= {0 < x < 10} because the domain is the dots along the x-axis. The curly brackets are used to show that these numbers all have something in common. The less than symbols are to show that x is more than 0 and less and 10 since the dots at the end are open dots meaning the values in between will be more or less than where the dot is. There is also that part here: x ε R, this symbol, ε, means that x is an element of R.
The range in the graph would be the highest and lowest point along the y-axis. So, the range of the graph above would be written like this R= {-1 ≤ y ≤ 1}. For this one, we used the less than symbol because the dots are closed dots.
If the graph has arrows, like this one:
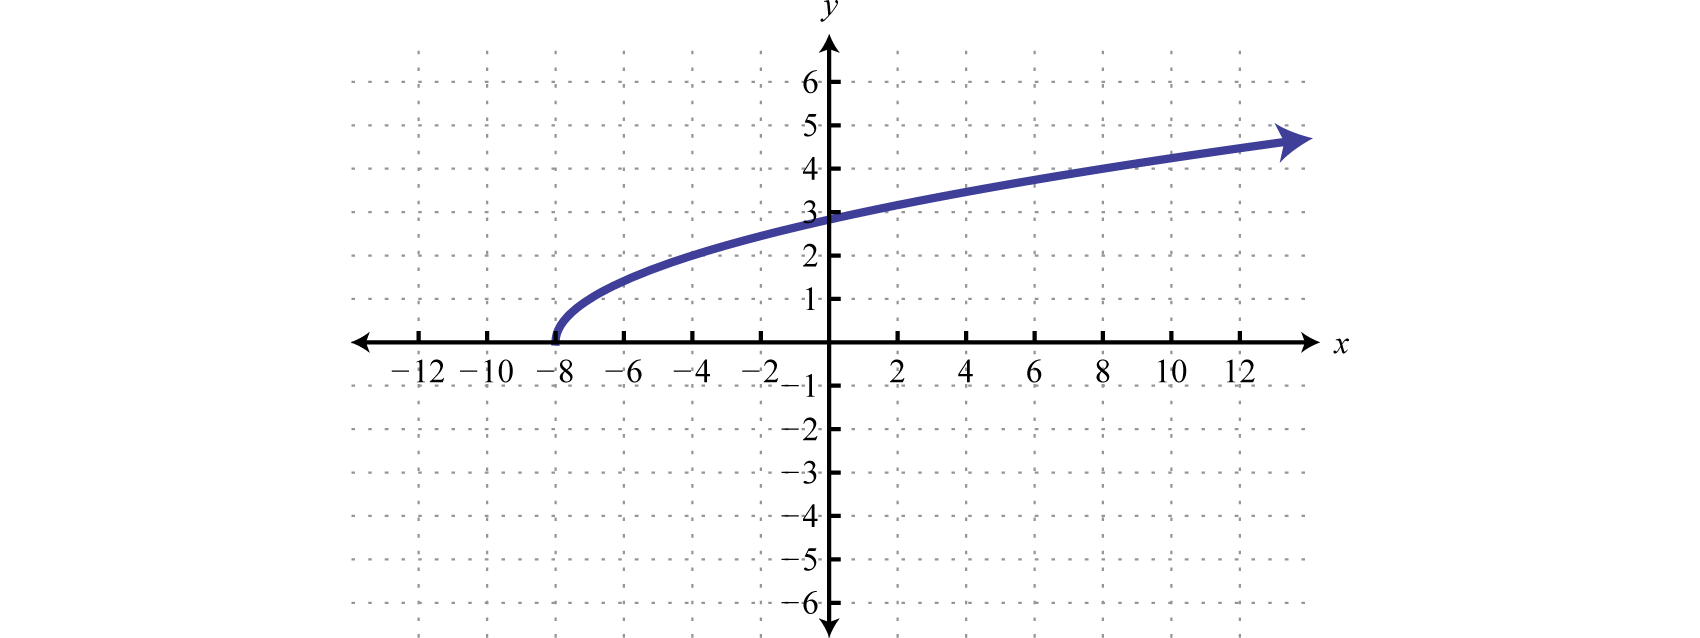
You would have to include xεR in the domain and yεR in the range because it is continuous. This symbol, ε, means that x or y is an element of R.