This week I learned how to graph linear reciprocal functions.
Here is a common question:
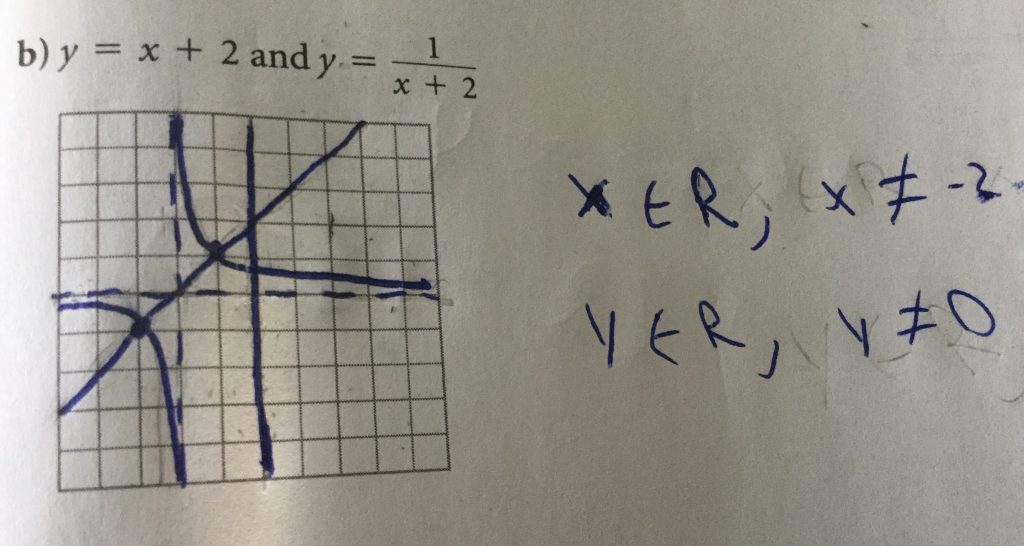
This question asked me for each pair of functions, use the graph of the linear function to sketch a graph of the reciprocal function, and state the domain and range. First I sketched y = x + 2 by using the slope and the y intercept. Then i had to sketch the reciprocal of that function. First I figured out where the invariant points so I could draw the vertical and horizontal asymptotes. The graph never cross the asymptotes. Then I could sketch in the reciprocal of the graph. The domain and range are both elements of the real numbers, but they do not go through the origin of the graph, because there is no reciprocal for 0.