In this week of precalc 11, we learned how to solve rational expressions, which are fraction questions with variables. One thing in specific we learned about was non-permissible values. These are values that x cannot be in each equation. First, here are some examples of what rational expressions can look like:

These expressions cannot have square roots, or exponents that are variables.
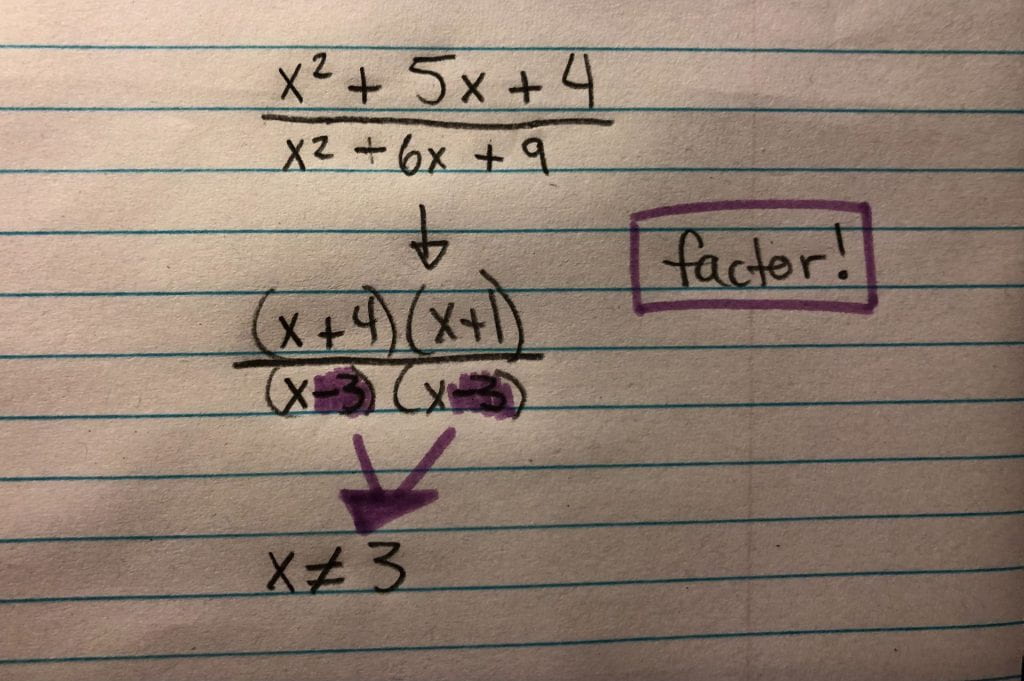
A non-permissible value is also known as a restriction, the domain, or values that the expression cannot be defined by. This means there are certain numbers, that when put in place of x, make the denominator zero. When the numerator is zero the equation can still be simplified. However, when the bottom of the fraction (the denominator) is zero, this is not possible. Therefore, these are non-permissible. When you write these restrictions, use the equal symbol with a line through it, meaning “x cannot be equal to…”
Here are the non-permissible values for the expressions shown above:

For example, in the second expression, x cannot be -12. If it was, it would look like this:

Since the denominator is now zero, which is impossible, it means -12 is the restriction on this expression. There can also be multiple restrictions, depending on the fraction and number of variables. The last example had a fraction as a restriction, which is not as easy to solve in your head. This is how I solved to find -3/4:

Here are a couple more examples:

In this week of precalc 11, we learned about solving inequalities. This was partly a review from grade 9, with new skills added on. Linear equations make a line on a graph, while quadratic equations create a parabola (a curved symetrical shape). Both of these equations can be inequalities as well.
Here are some examples of linear inequalities:
6x > 18
4x + 1 < 9
3x – 3 ≥ 4x + 1
These are all quadratic inequalities:
x² + 3x + 2 ≤ 0
2x² > -3x – 7
x² – 7x + 9 ≥ 9
To solve an inequality, you must get the variable on its own. For example:
For this inequality: 6x > 18, you divide both sides by 6, so the x is by itself. Therefore, x would be greater than 3 (x > 3)
To solve this inequality: 3x – 3 ≥ 4x + 1, start by subtracting the 4x from both sides. Then add the 3 from the left side to the right. This would create the equation: – 1x ≥ 4. To make x positive, divide both sides by negative 1. This would make x less than or equal to 4 (x ≤ -4), because when you multiply or divide by a negative, the sign changes.
Here is one final example using the quadratic inequality: x² – 4x > 5
This is done a bit differently than the linear inequalities because you need to factor. First, move the 5 to the left side so the inequality has the zero on the right: x² – 4x – 5 > 0
Then, factor the right side: (x – 5) (x + 1) > 0
Next, find the roots. This is the two numbers, 5 and 1, but with opposite signs: +5, -1.
Finally, write out the solution: x < -1, and x > 5. This is the answer because the original question asked where the inequality was greater than 0. Because this equation would open up and have a minimum vertex (the x² was positive), it is greater than zero to the left (less than -1) and to the right (greater than 5) of the parabola. In between the parabola, x is less than 0, so it wouldn’t satisfy the inequality.
In week 10 of my precalc 11 class, we learned about three different forms of equations that can be graphed, and how to convert them from one to another. Here are the different forms (with examples below):
General Form: y = ax² + bx + c
y = x² – 2x + 4
y = -2x² + 5x -16
Standard or Vertex Form: y = a(x – p)² + q
y = (x – 4)² + 7
y = 3(x – 2)² – 1
Factored Form: y = a(x – x₁)(x – x₂)
y = 2(x + 7)(x – 3)
y = (x – 5)(x – 2)
Each of these equation types can show different things about what the graph will look like. For example, the last number (with no variable) in general form tells you the y-intercept. The 2 numbers after the x in factored form are the roots of the equation (make sure to change the signs first). In order to fully graph a quadratic equation, sometimes you need to convert one form of the equation into another. Here is how to convert general form into factored or standard:

This is how to change standard/vertex form into general or factored:

Finally, here is how to convert factored form into general or standard:

This week in precalc 11, I continued learning about the connection between graphing and quadratic equations. One thing specifically that I learned about was how to plot the vertex on a graph, when given a quadratic equation. The “parent function” is like the original graph. It is created from the equation y=x². For this graph, the vertex is at the coordinates (0,0). This is what the parent function graph looks like:

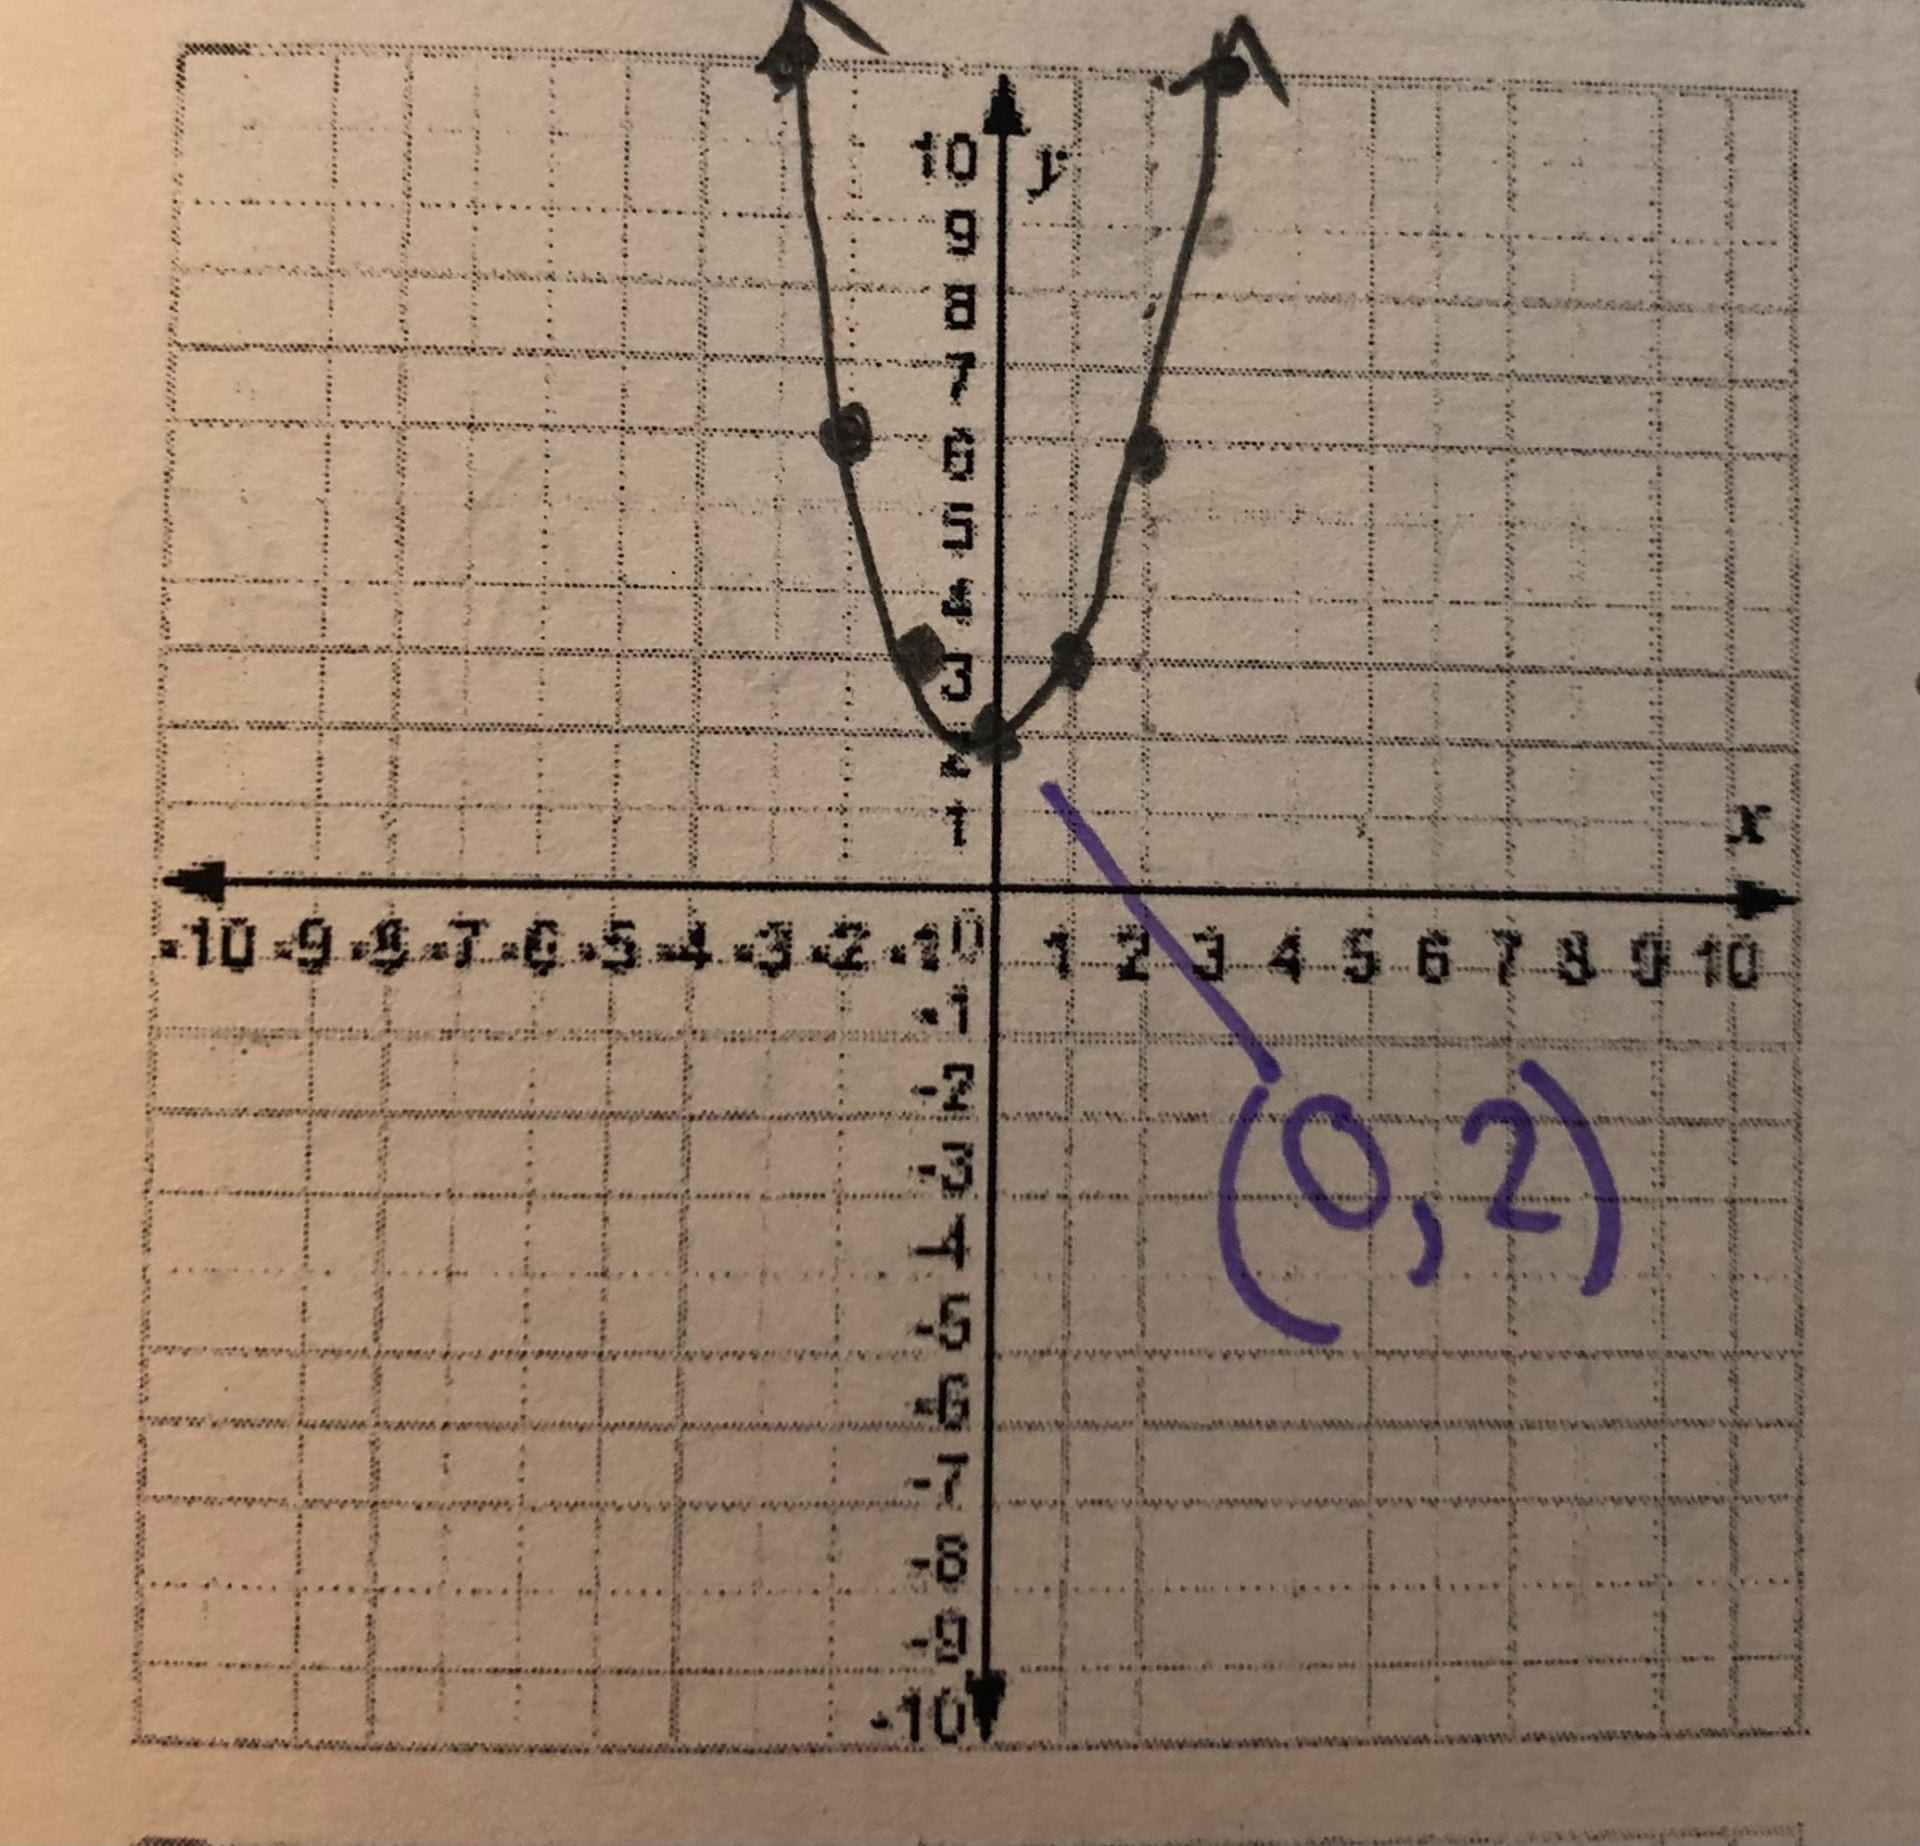
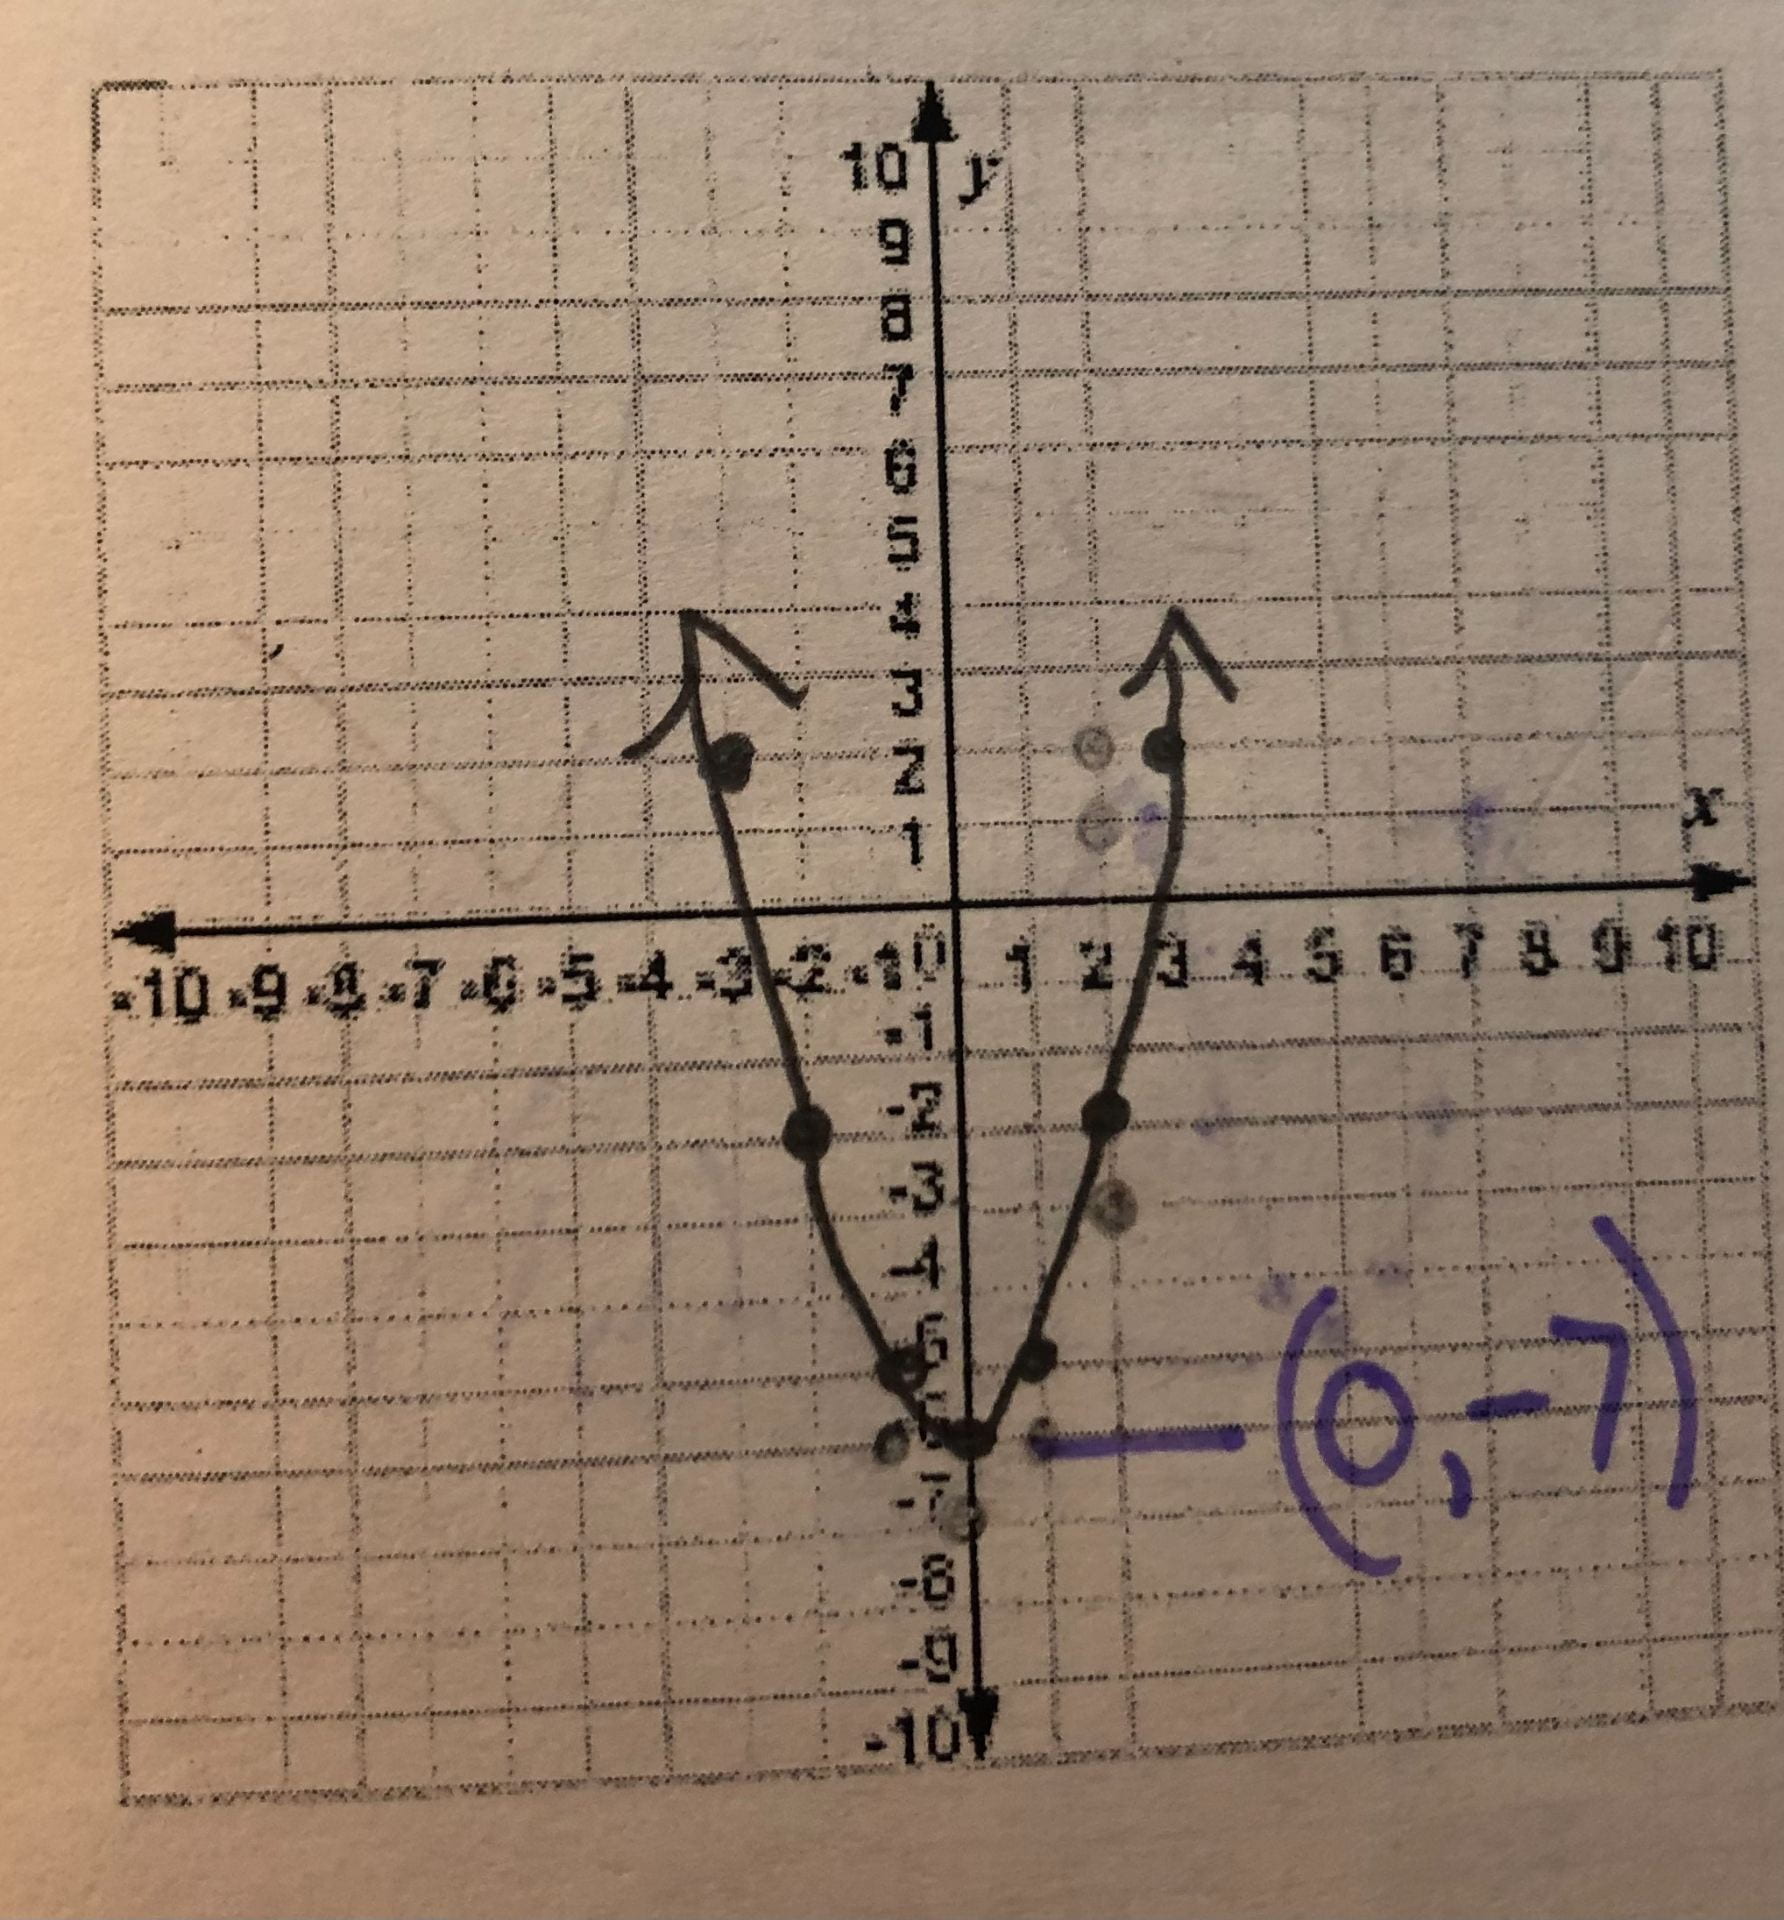
When graphing an equation different than y=x², there are a few ways to find the coordinates of the vertex. First, see if there is a last number (without a variable) in the equation. This tells you where the vertex will be on the y-axis. If the number is positive, move the vertex upwards (the amount of spaces the number says). If it is negative, move down. As you can see below, the parabola is still the same shape and size as the parent function, just shifted in a different direction. Here are some examples:
y = x² + 2
y = x² – 7
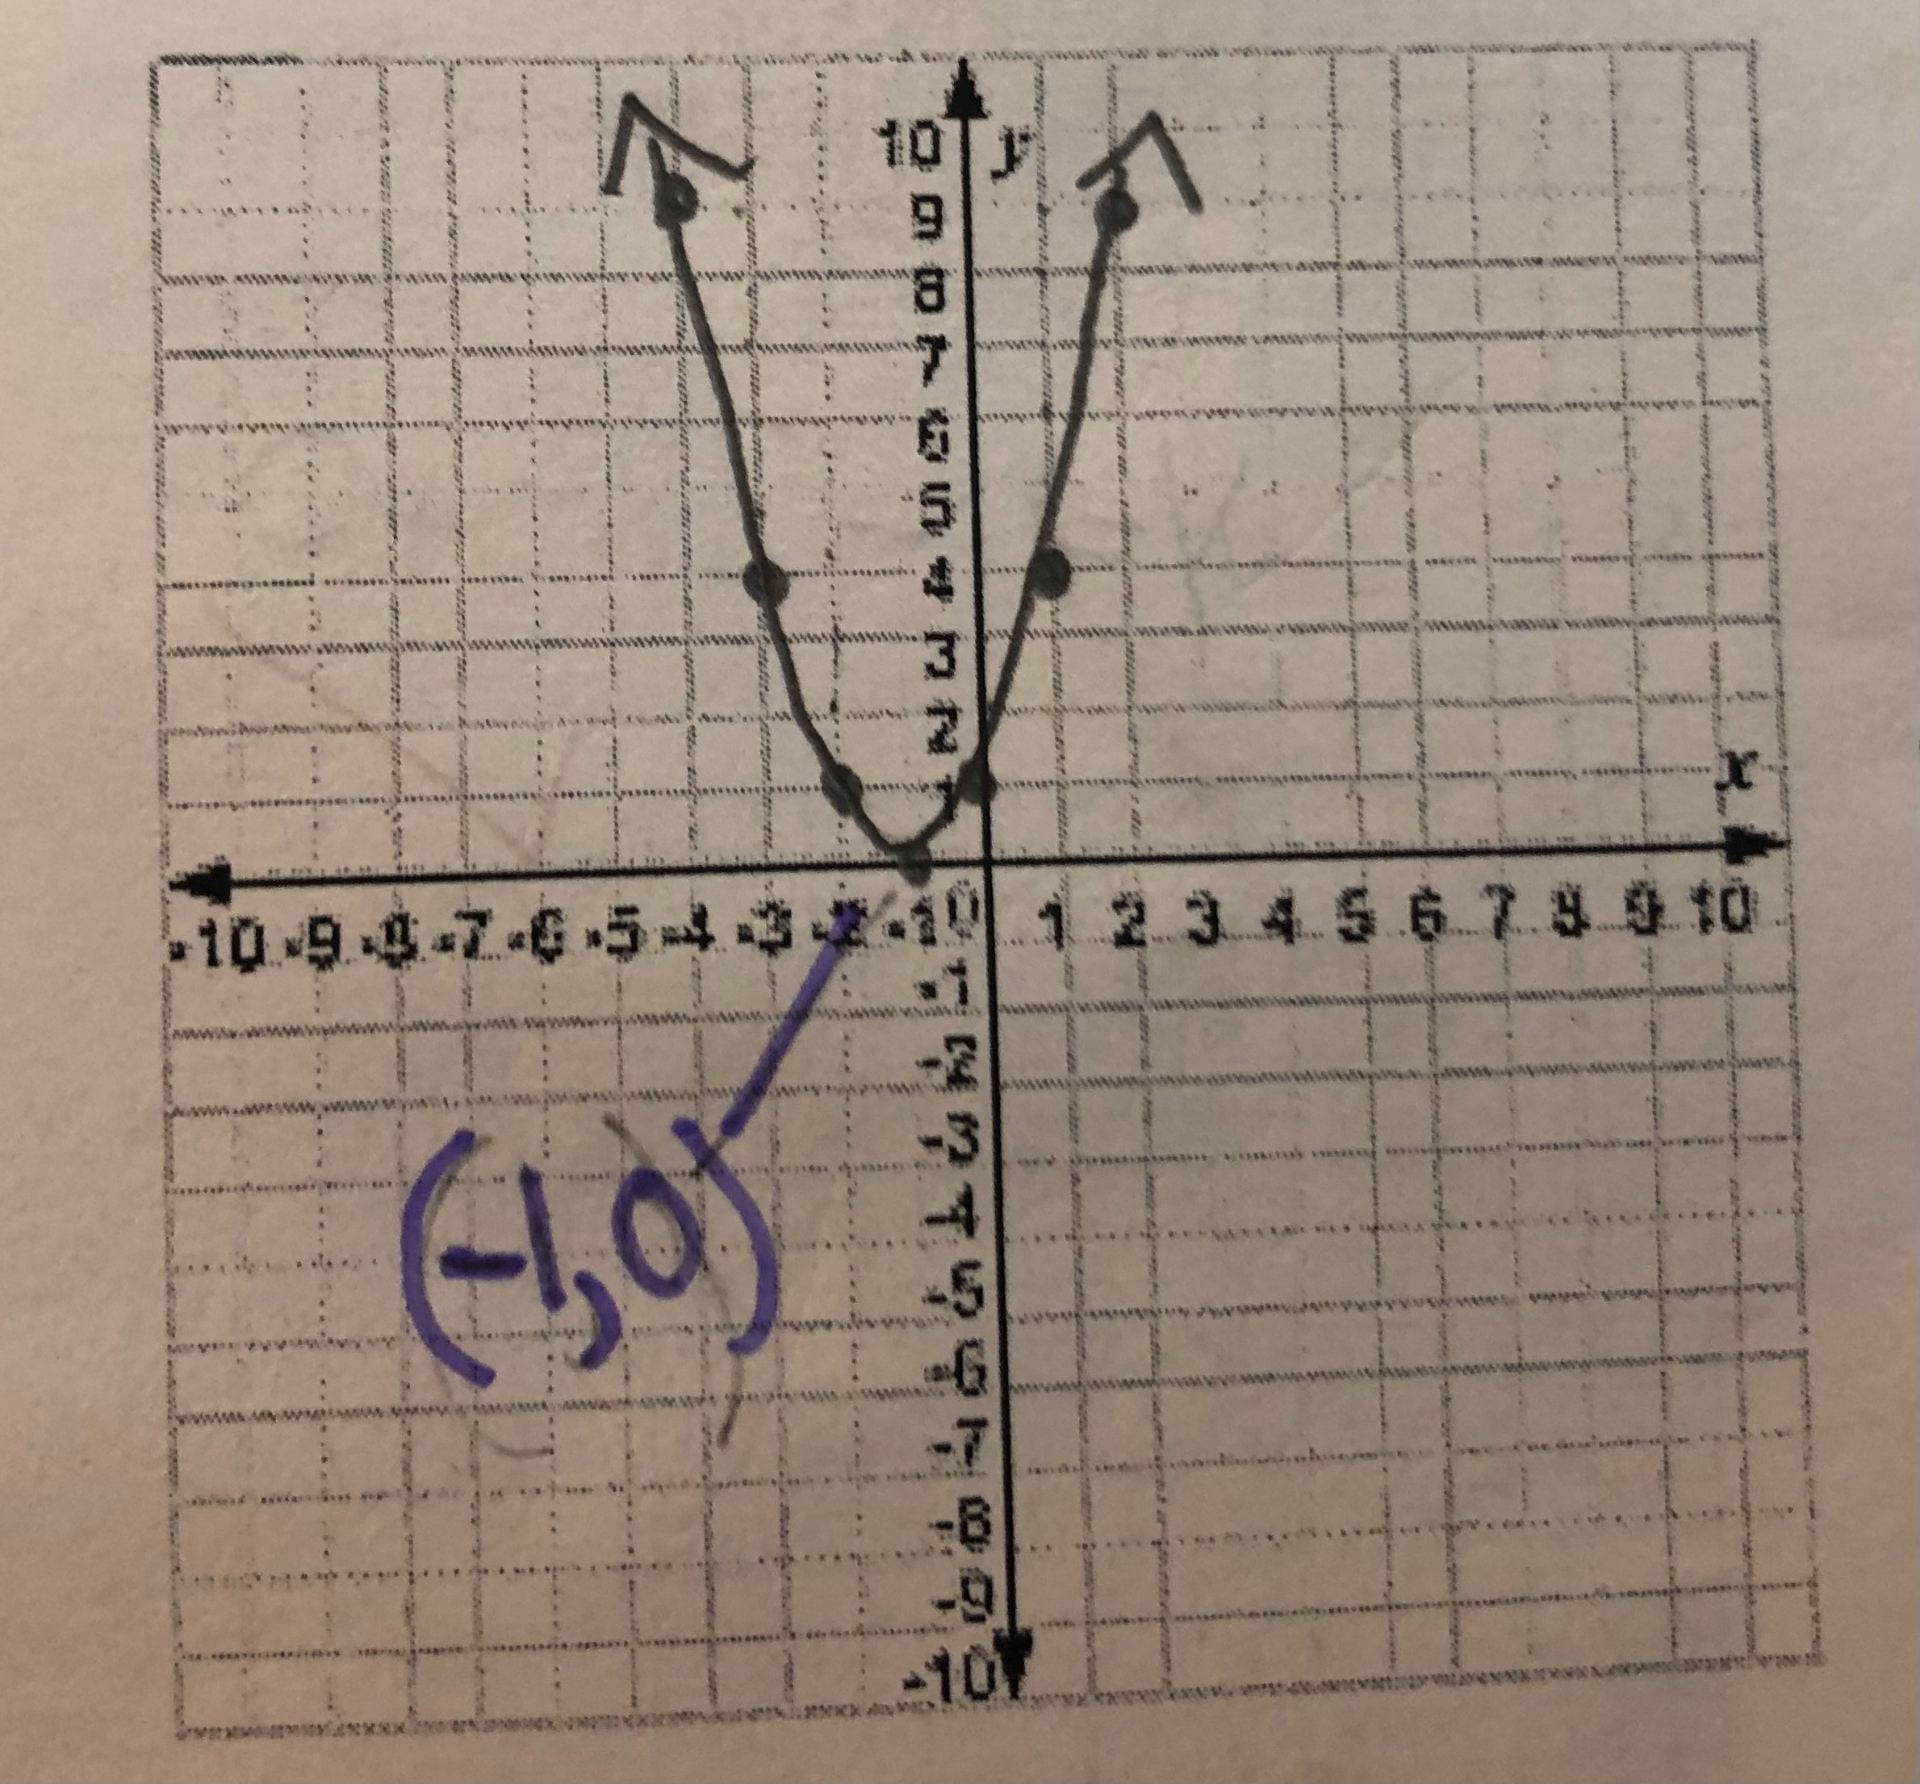
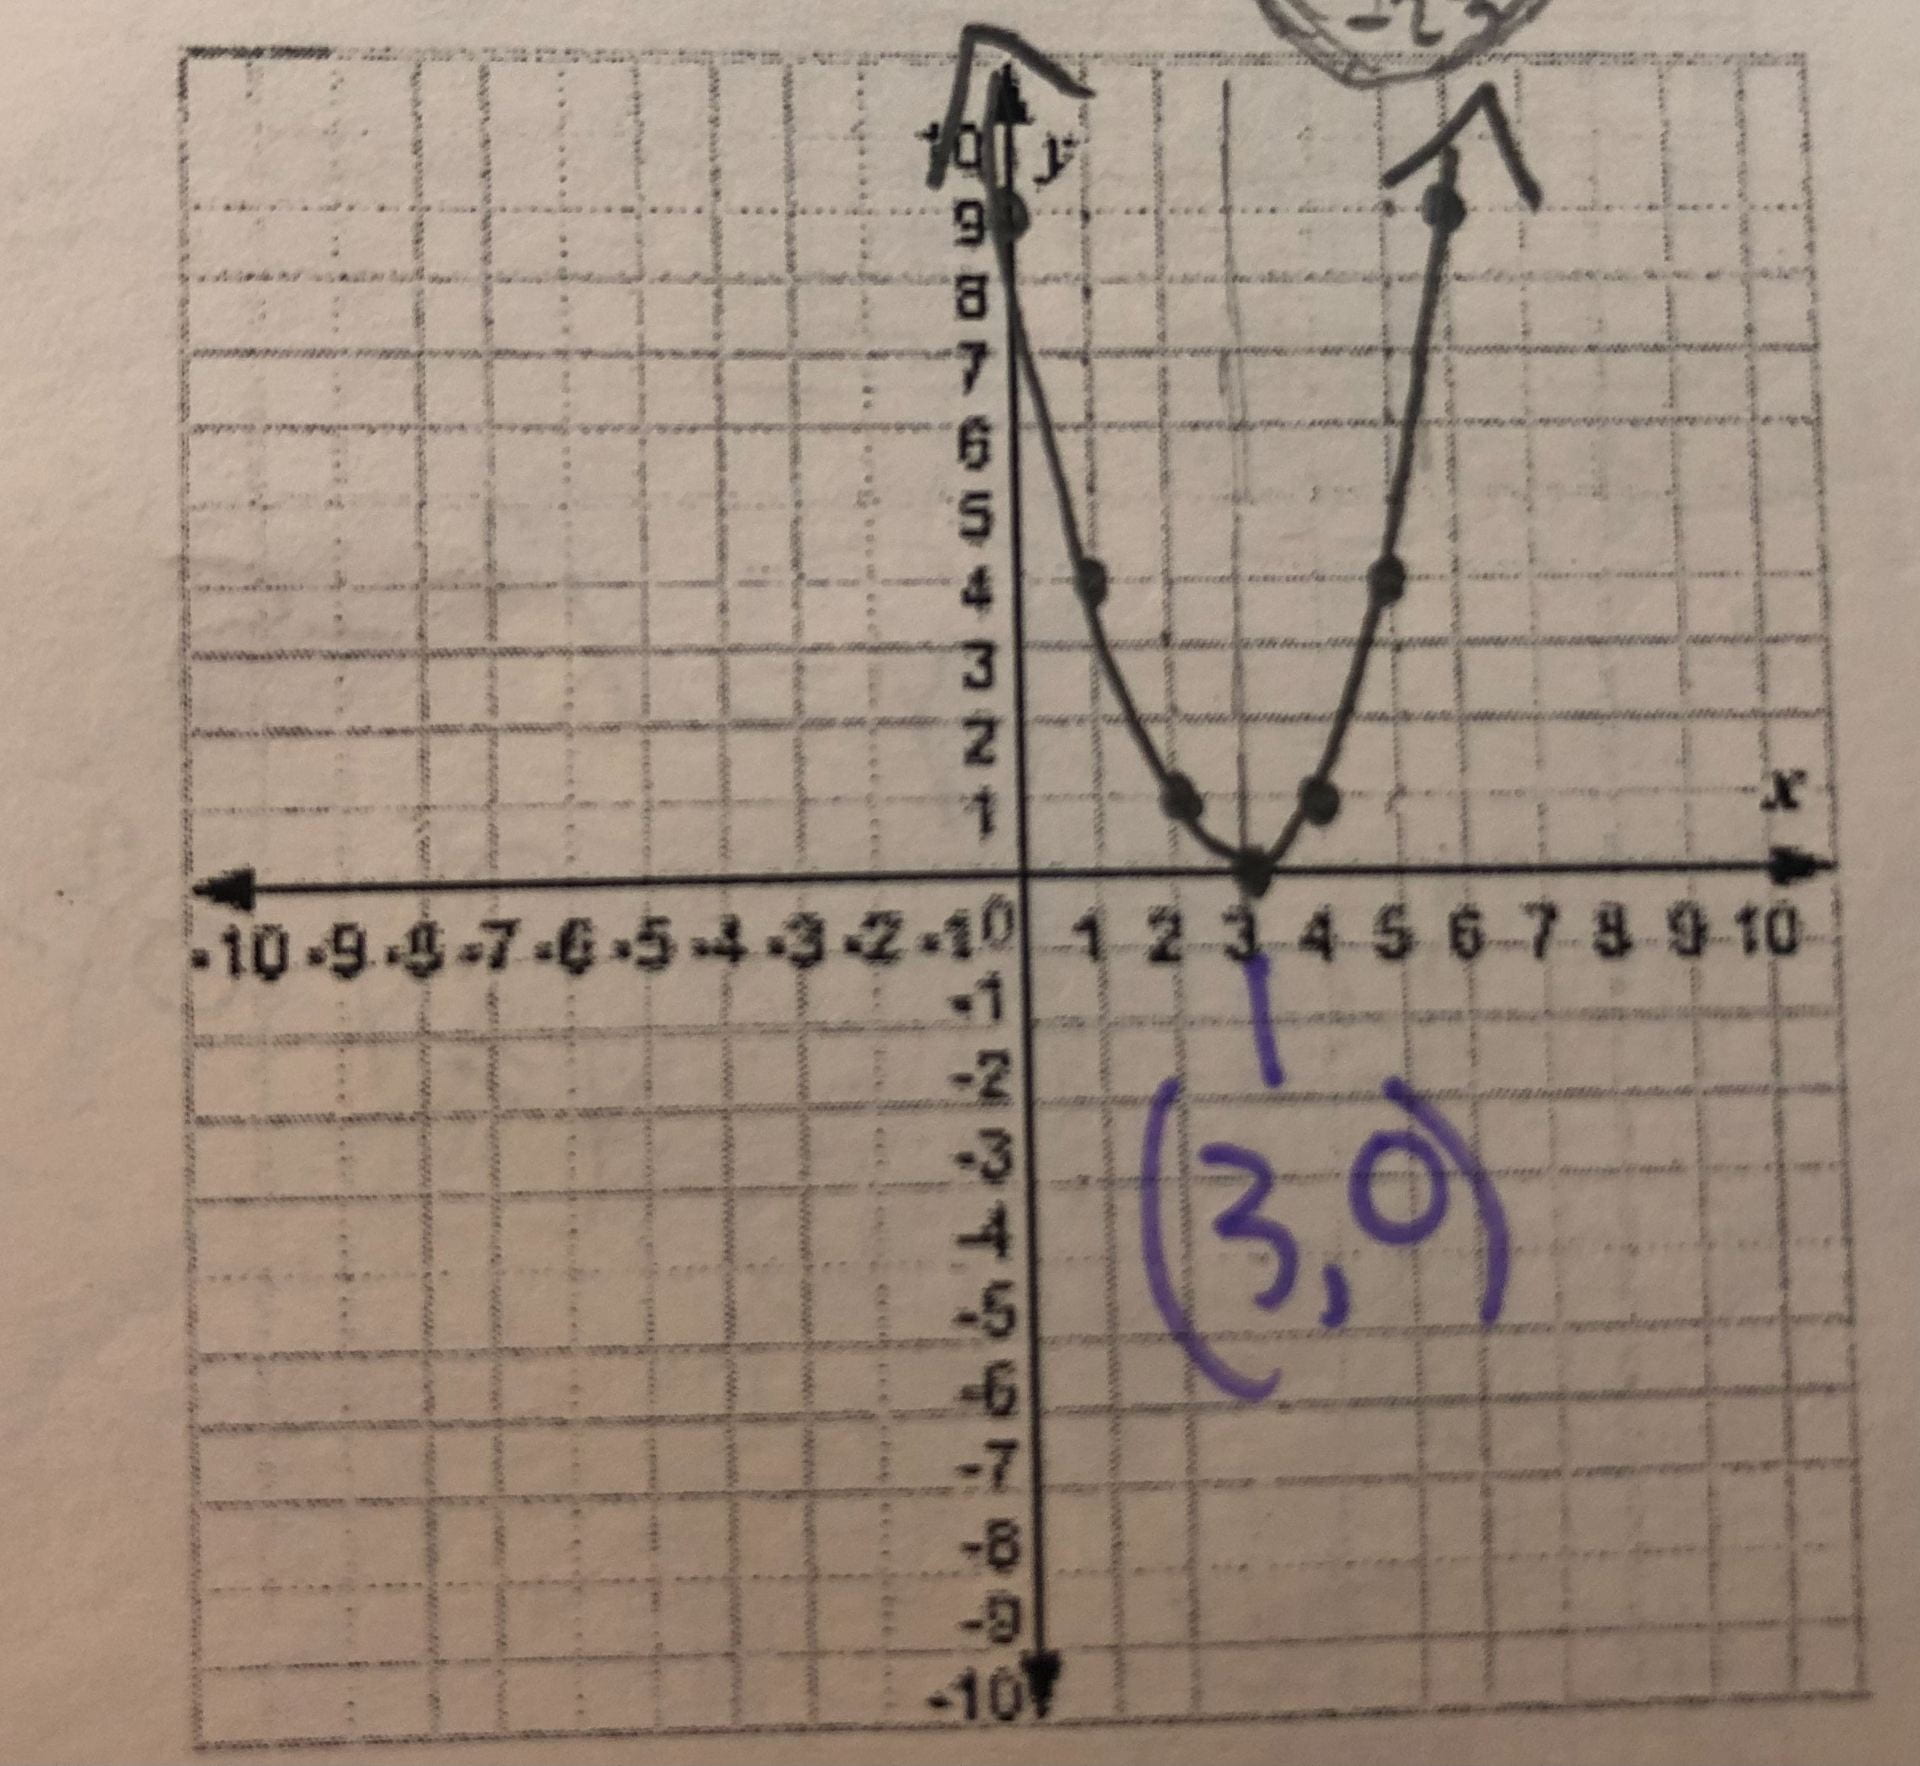
If there is a number either added or subtracted from the x, this tells you where the vertex is on the x-axis. If the number is positive, move the vertex to the left. If it is negative, move to the right. Here are some examples:
y = (x + 1)²
y = (x – 3)²
Finally, these two things can be combined in an equation, so the vertex has coordinates that do not include zero. Here are a few more examples:
y = (x – 3)² + 4

y = (x – 1)² + 1


