Experimental Lab- Lacteeze lab


Purpose:

To determine the effects of temperature on the enzymatic process of lactase

Hypothesis:

Higher temperatures will yield a higher concentration of glucose. The reaction rate of lactase will be higher under warmer temperatures.

Materials:

  • 8 Diastix strips
  • 7 test tubs
  • 7 stoppers
  • Thermometer
  • Milk
  • Lactase Drops
  • Boiling Water
  • Ice Water
  • Tap Water
  • Graduated Cylinder
  • 3 beakers

Procedure:

  1. Pour 15ml of milk into each test tube
  2. Test the initial concentration of glucose in the milk: Dip a Diastix strip into the milk. Remove and place on a paper towel and wait 30 seconds.
  3. After 30 seconds, observe the colour change of the Diastix strip, refer to the bottle’s chart and record the corresponding concentration of glucose.
  4. Prepare the different temperature water baths for each test tube. (prepare three water baths at a time)
  5. With the help of the thermometer, create water baths by mixing together tap water, boiling water, and ice water so they are the following temperatures: 5°C, 10°C. 20°C, 23°C (room temperature), 37°C, 40°C, 45°C
  6. Before placing the individual test tubes in their baths, measure the water and record the exact temperature.
  7. Add one drop of Lacteeze into a test tube, insert the stopper, and flip the test tube twice to mix the enzyme.
  8. Place the test tube of milk into the bath for 15 minutes
  9. After the 15 minutes are up, remove the stopper and find the concentration of glucose by using a Diastix strip
  10. Like before, dip the strip into the milk, remove and place on a paper towel. Wait 30 seconds then record the results of the Diastix strip.
  11. Repeat steps 7-10 for each test tube.
  12. Record the data into the data table.
  13. Graph the data.

Data:

Observations and Analysis

The beakers with the highest concentrations of 111mmol/L or more were in the beakers that were 6°C, 23°C, and 37°C.  It’s worth noting that 37°C is body temperature. The lowest concentration was at 20°C. and the second lowest were at 10°C, 40°C, and 45°C. If we exclude the data point of the first beaker (5°C), the graph vaguely matches the reaction rate curve that was anticipated. The lower temperatures had lower reaction rates, then it reaches its peak reaction rate, and after that peak is reached, the reaction rate begins to decrease again.

Conclusion/Questions

How does temperature affect enzymatic processes?

Increasing the temperature (up until a certain point) will increase the efficiency of the enzymatic processes. This is because at higher temperatures the particles are moving faster, and more collisions are happening. These factors increase the likelihood of a successful reaction between the reactants, so the reaction rate will increase. If the temperature gets too hot, we begin to see the reaction rate actually drops. This is because the enzymes have started to denature, rendering them unable to perform their duties.

Why does the concentration of glucose begin to decrease at higher temperatures?

As mentioned before, the enzymes begin to denature if the temperature is too high (usually when it’s above 45°C). When an enzyme denatures, it is unable to properly perform its function which in this case is facilitating the reaction. As we increase the temperature past the denaturing point, more and more enzymes will stop functioning therefore decreasing the reaction rate which in turn decreases the production of glucose.

How did this lab help with your understanding of enzymes?

It helped a little bit. I was able to vaguely see the impact temperature made on the enzymes. It allowed me to apply my learning to an actual situation which in turn helps me remember the process. However, due to a variety of factors and/or possible errors.

What went well in this lab?

I think the thought put behind the design was quite good. We used a good variety of temperatures. For example, we had one at room temperature, body temperature and a couple above and below the denaturing point of the enzyme. This, in theory, would give us a diverse spread of results.

What are some problems/possible sources of error you encountered? How could the lab be improved?

The results of beaker one did not follow our theory. We believe that is likely due to an error. We found that the results weren’t as varied either. Our Diastix strips don’t provide a big enough range for our results. We could improve that by either using a testing strip that has a larger/more precise range or by reducing the amount of time we let the lactase react with the milk. Another potential source of error could be the temperature. We don’t know for certain if the initial temperature was maintained throughout the entire experiment. For example, the beaker at 6°C could’ve started to warm up during the 15 minutes. This increase in temperature will skew the results since the enzyme is now working under a higher temperature. We also didn’t give the milk time to properly adjust to the new temperature. We measured the temperature of the water, not the milk. When we initially put the milk in the water bath, it is at room temperature. After that the milk’s temperature increases or decreases during the 15 minutes. This means the temperature recorded may not reflect the actual temperature the enzyme was working under. These errors could be avoided by using containers with better insulation for the water bath. We could also base our temperature off the milk rather than the water. We could do that by placing the milk in the water bath but waiting until the milk itself adjusts to the right temperature.

AGAR CUBE LAB

Diffusion in Agar Cubes

Calculations:

Observations:

Placed before solution

few seconds after placed into solution

10 min in solution

Cut in half


Conclusion Questions: 

1. In terms of maximizing diffusion, what was the most effective size cube you tested?

The maximum diffusion, which is the most effective size was the smallest cube size which was  1cm X 1cm X 1cm.

2. Why was the size most effective at maximizing diffusion? What are the important factors that affect how materials diffuse into cells or tissues?

The smallest cube was most effective because it had the smallest volume which made it easy for the diffusion to happen throughout the whole cube. Important factors that affect how materials diffuse into cells or tissues are polarity, temperature, size of cell, concentration, and type off materials used.

3. If a large surface area is helpful to cells, why do cells not grow to be very large?

Cells don’t grow to large sizes because the cells surface area increases which also means the volume will too. This will cause diffusion to be inefficient, the process of diffusion will not happen throughout the whole cell. The way the cell grows is because there is less membrane for the substances to diffuse throughout the centre of the cell, which results in the cell will be lacking the substance that it needs.

4. You have three cubes, A, B and C. They have surface to volume ratios off 3:1, 5:2, and 4:1 respectively. Which of these cubes is going to be the most effective at maximizing diffusion, how do you know? 

The cube that would be most effective during maximum diffusion would be 4:1, because it has. a higher surface area to volume ratio.  There is more of a cell membrane than A and B because, every cubic unit of cytoplasm. This will show that inside the cube will effect the diffusion which allows material to enter the cytoplasm.

5. How does your body adapt surface area to. volume ratios to help exchange gases?

Our bodies contain a large organs, which form small sphere that cover as much surface area as possible, this is in order because it efficiently changes gases. Our bodies establishes where the gas exchange happens due to the sureface area and volume ratio.

6. Why can’t certain cells, like bacteria, get to be the size of a small fish?

Bacteria can’t be the size of a fish because they divide in order to keep a good surface area to volume ratio. In order for some cells to active they need to be small. To ensure proper diffusion throughout the whole cell there surface area to volume ratio would be to0 small.

7. What are the advances of large organisms being multi-cellular?

They contain cells that have their own specific functions, where a unicellular only has one cell with one function. They also grow to a larger size, but they can still be small. This is because of the increase of cell number  in the organisms over a period of time.


DNA and Protein Synthesis – Transcription and translation

Transcription

1. How is mRNA different from DNA?
mRNA is different form DNA. DNA is made up of deoxyribose sugars, whereas mRNA is made up of ribose sugars. DNA has thymine as one of the two Pyrimidines and mRNA has Uracil as its Pyrimidine base. DNA is found in the Nucleus, while mRNA diffuses into the cytoplasm after synthesis. DNA is double-stranded and mRNA is single-stranded.

2. Describe the process of transcription.
The process of transcription starts with the information from one gene is then copied onto a
strand of mRNA. DNA helicase breaks the hydrogen bonds between the pairs throughout the
chain. Then, the complimentary base pairs of the RNA join onto what is called the sense strand, which is
the strand with the enzyme “polymerase”. Lastly, when the whole gene has been transcribed, the RNA strands parts from the DNA and exits the nucleus to deliver the message derived from the DNA. The DNA then reconnects the two strands.

RNA polymerase is copying the DNA onto the mRNA

mRNA strand

RNA strand parted from the DNA to deliver the message from the DNA

3. How did today’s activity do a good job of modelling the process of RNA transcription? In what way was our model inaccurate?
This activity did a good job of modelling the process of RNA transcription as it used different
coloured beads to show uracil from thymine. It also used a different coloured pipe cleaner (red)
to represent the RNA strand. The model was inaccurate because a real gene strand is 1000 nucleotides long while the one
we modeled was only 18.


Translation

1. Describe the process of translation: Initiation, elongation, and termination.
The process of translation starts with “initiation”, where a ribosome looks for the start codon “AUG”, from the mRNA. A ribosomal subunit then binds together (red paper) and starts to read the mRNA. The first codon starts with the “AUG”, which is placed on the “P” site. Then the next step is elongation where the “A” site on the ribosomal subunit, is ready for the next tRNA (Green paper). The tRNA with the anticodon matches to the mRNA. The tRNA is holding the matching amino acid (Blue paper) to the codon. When one tRNA binds to the codon on the “P” site, there is another codon which binds on the “A” site. Once the “A” site grabs its corresponding amino acid, the codon in the “P” spot will release, and the amino acids on the “P” codon will join onto the “A” codon. The codon in the “A” site will now shift to the “P” site, and the process will repeats. The last step is termination. The elongation process ends when the ribosome reads a “Stop” codon. A “stop” codon has no matching tRNA amino acids. After this codon, no amino acid is added and the polypeptide is released and the ribosomes detach from the mRNA.


The Ribosome on the start codon “AUG” which attaches
to its first tRNA amino acid.

The tRNA on the “P” site leaves and its amino
acids join onto the “A” site tRNA.

Termination happens and both tRNA
detach from the mRNA.

2. How did today’s activity do a good of modelling the process of translation? In what ways was our model inaccurate?
The activity did a good job modelling this process because it clearly showed the process of how
tRNA bind with each codon, by using the pieces of different coloured paper it was a good visual represention. It was inaccurate because the RNA was missing the phosphate-sugar strand. It only showed bases. Also, the size and shape of the
amino acids were not accurate.


DNA and Protein Synthesis

DNA STRUCTURES:

1.  Explain the structure of DNA — use the terms nucleotides, antiparallel strands, and complimentary base pairing.

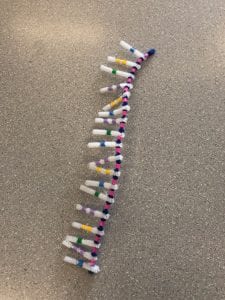
DNA is a large polymer (ladder- like) made from nucleotide monomers. DNA is also made up of sugars, phosphate, and nitrogen bases. DNA has two phosphate- sugar backbones that have nucleotide bases facing inwards of each other. From there, the bases attach to each other through a hydrogen bonds; which are across from each other making “rungs” of the ladder. Which will will show our four bases – Two pyrimidines – called Thymine (blue bead) and Cytosine (Green bead), and two purines, called Adenine (yellow bead) and Guanine (purple bead). The pyridines are single ringed and purine are double ringed bases. Complimentary base pairing is when a purine must bond with a pyrimidine this happens so, it keeps a correct distances from the bases in the ladder and keeps them in order. Guanine (G) always bonds with Cytosine (C), and Adenine (A) always bonds with Thymine (T).  Antiparallel is two stands in the DNA ladder, that get “read” in opposite  directions. It would be “read” like phosphate, sugar, phosphate, sugar, on one side of  the stand and on the other sugar, phosphate, sugar, phosphate. This is shown in our model.

2. How does this activity hep model the structure of DNA? What changes could we make to improve the accuracy of this model? Be detailed and constructive.

This activity was very useful and helpful, showing us how DNA looks. When we had to match up the base pairs, this helps knowing the reason for complimentary pairing, and when creating two separate opposite stands helps understanding the antiparallel shape. I believe a way that could make this model more accurate is having a better representing of the antiparallel part of the two strands. Since the beads moved along the pipecleaner , it made it easy for them to slide and end up looking the same. A solution could have been to put the letter “P” (representing Phosphate (Pink)) in the direction of the strand being read. An other way to make the model better could have been, having the bases as small beads on the pipecleaner (white) leaving lots of space in between the bases and backbone. It kind of made it look like something else was attached or there on the bases to the backbone, not the base bonding to the backbone. An idea could be to have smaller piece of the pipecleaner in four different colours, instead of beads. This way you could use a smaller piece for pyrimidines and a longer piece for purines, this would make it easier to understand the bonding between them.


One strand of DNA

Untwisted Double strand of DNA 

Double helix DNA


DNA Replication:

1. When does DNA replication occur?

DNA replication occurs when cells need to divide in order to repair, replacement, and grow. An example would be when you get a cut, damage your skin, grow, and when cells die. DNA replicates because cells need to double in everything, this includes genetic information.

2. Name and describe the 3 steps involved in DNA replication. Why does the process occur differently on the “leading” and “lagging” strands?

The first step in DNA replication is unwinding. This happens when DNA straightens from a double helix to a straight ladder structure. In our model above of the flat DNA strand, it then has a DNA Helicase enzyme (the watermelon candy) slides along the base pairs and breaks the hydrogen bond which splits them into two separate strands.

The second step in DNA replication is complimentary base pairing. This is when unbounded nucleotide in the nucleus move to make hydrogen bonds with their partners on single DNA strands. This happens from DNA polymerase (blue foot candies).

The last step of DNA replication is joining. This is when nucleotides on the new strand make covalent bonds with each other to make new double stranded DNA molecules. When the two strand are splitting, they get read differently, and at the same time new strands are being made; because they are antiparallel. One side gets read from bottom up, that’s the new DNA being formed; it’s a continuous unzipping of the DNA which is the leading strand (blue Bigfoot toe is pointing up on the right side). On the other side of the unzipping  DNA  is called the lagging strand, this is because it starts from top down therefore its read in fragments as the DNA unzips (blue Bigfoot toe is pointing down on the left side). The fragments are joined together why DNA ligase, which takes longer.

3.  The model today wasn’t a great fit for the process we were exploring. What did you do to model the complimentary base pairing and joining of adjacent nucleotides steps of DNA replication? In what ways was this activity well suited to showing this process? In what ways was it inaccurate?

The way we showed complimentary base pairing is placing thorn DNA polymerase (blue Bigfoot) on the bases, showing them being Hydrogen bonded. To show the joining stage of the nucleotides, we placed the DNA ligase (red Bigfoot) on the back bone showing the connection.  I really liked this activity due to the fact it was a great way to demonstrate DNA replication as the pipecleaners are easily separated. Also, they can bend, easily showing the process of the new pipecleaner DNA being built. The difficult part was showing the lagging strand and how its read in pieces, making the DNA made in sections joined by DNA ligase. Another problem when showing the model was the pipecleaners representing the backbone had to remain whole and we had to cover up pieces of pipecleaner with extra paper.


DNA helicase unzips the nitrogen bases

DNA Polymerase forms new bonds with nitrogen bases on the leading and lagging strand, and the DNA ligase bonds the sections together on the lagging strand

Two identical DNA strands