During Pre-Cal this week i learned how to solve a chart with the properties of quadratic functions. To chart a quadratic equation you have to know how to tell when the table of value is showing a quadratic equation, instead of a linear equation. A linear equation in a table of value always has a y value (the output) that goes up or down by the same amount each time in the first differences. A quadratic equation in a table of value always has a y value that goes up or down by the same amount each time in the second difference. Below is a example of both a linear equation, and a quadratic equation charted.

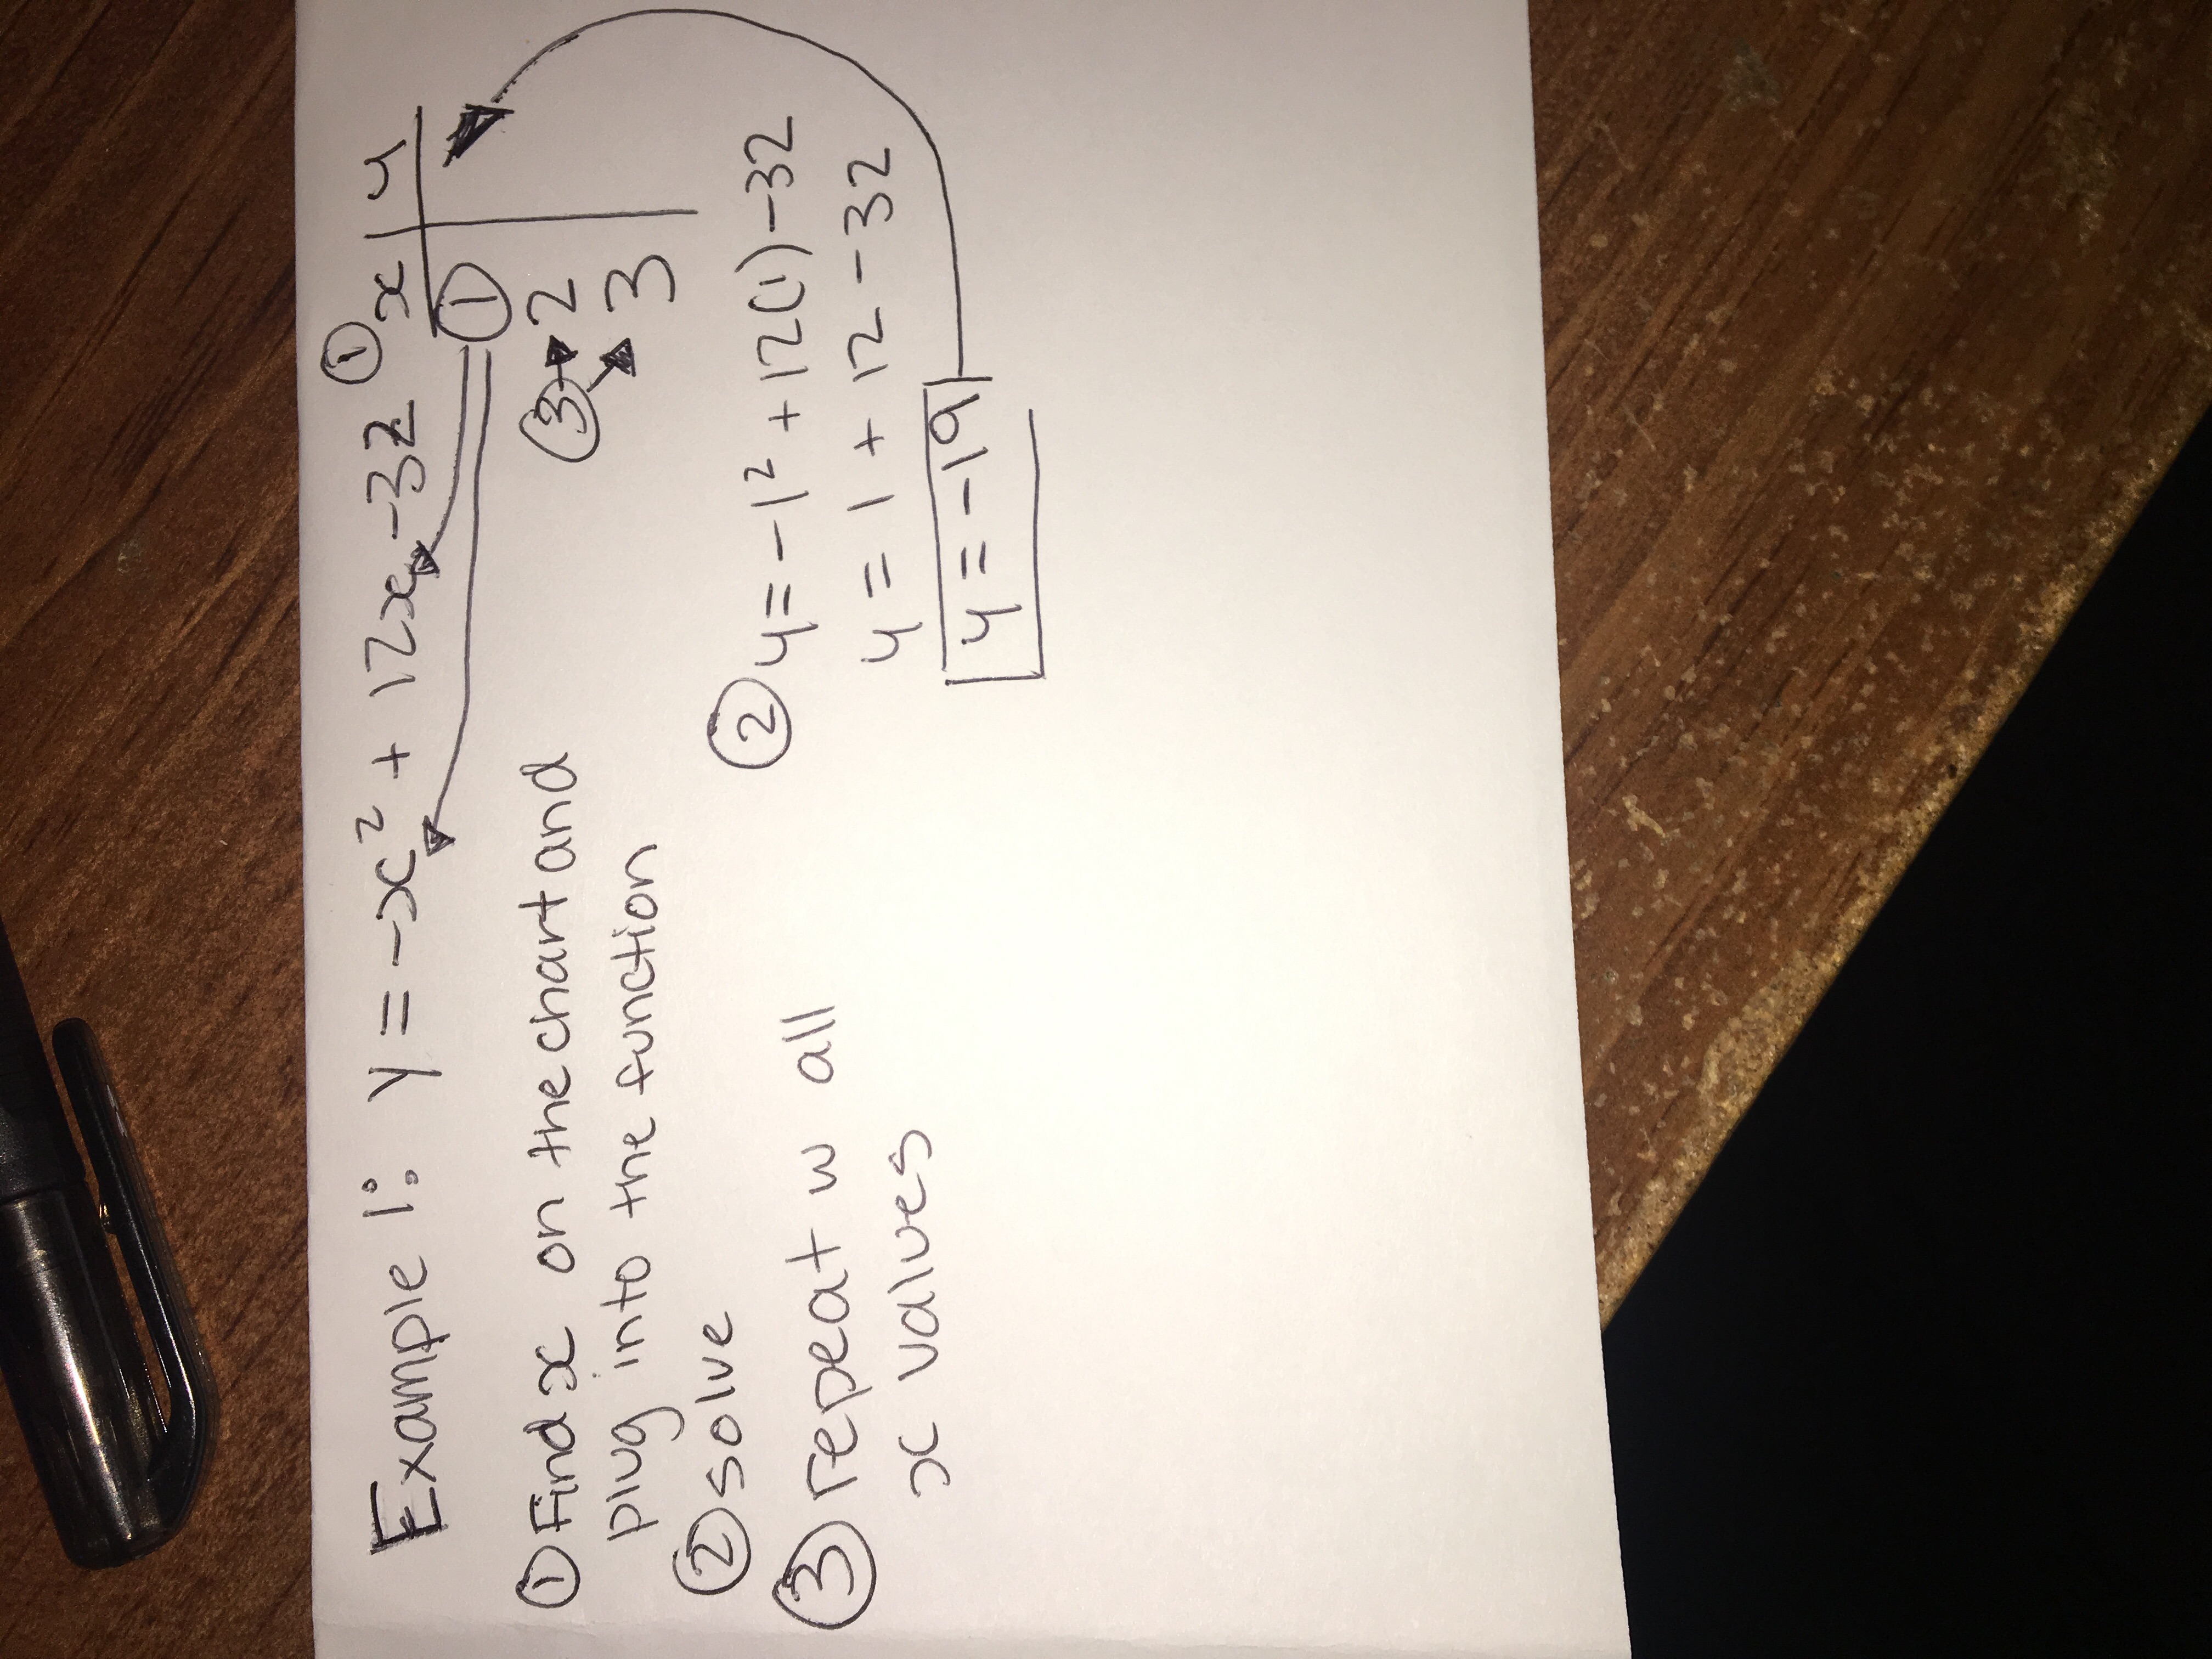
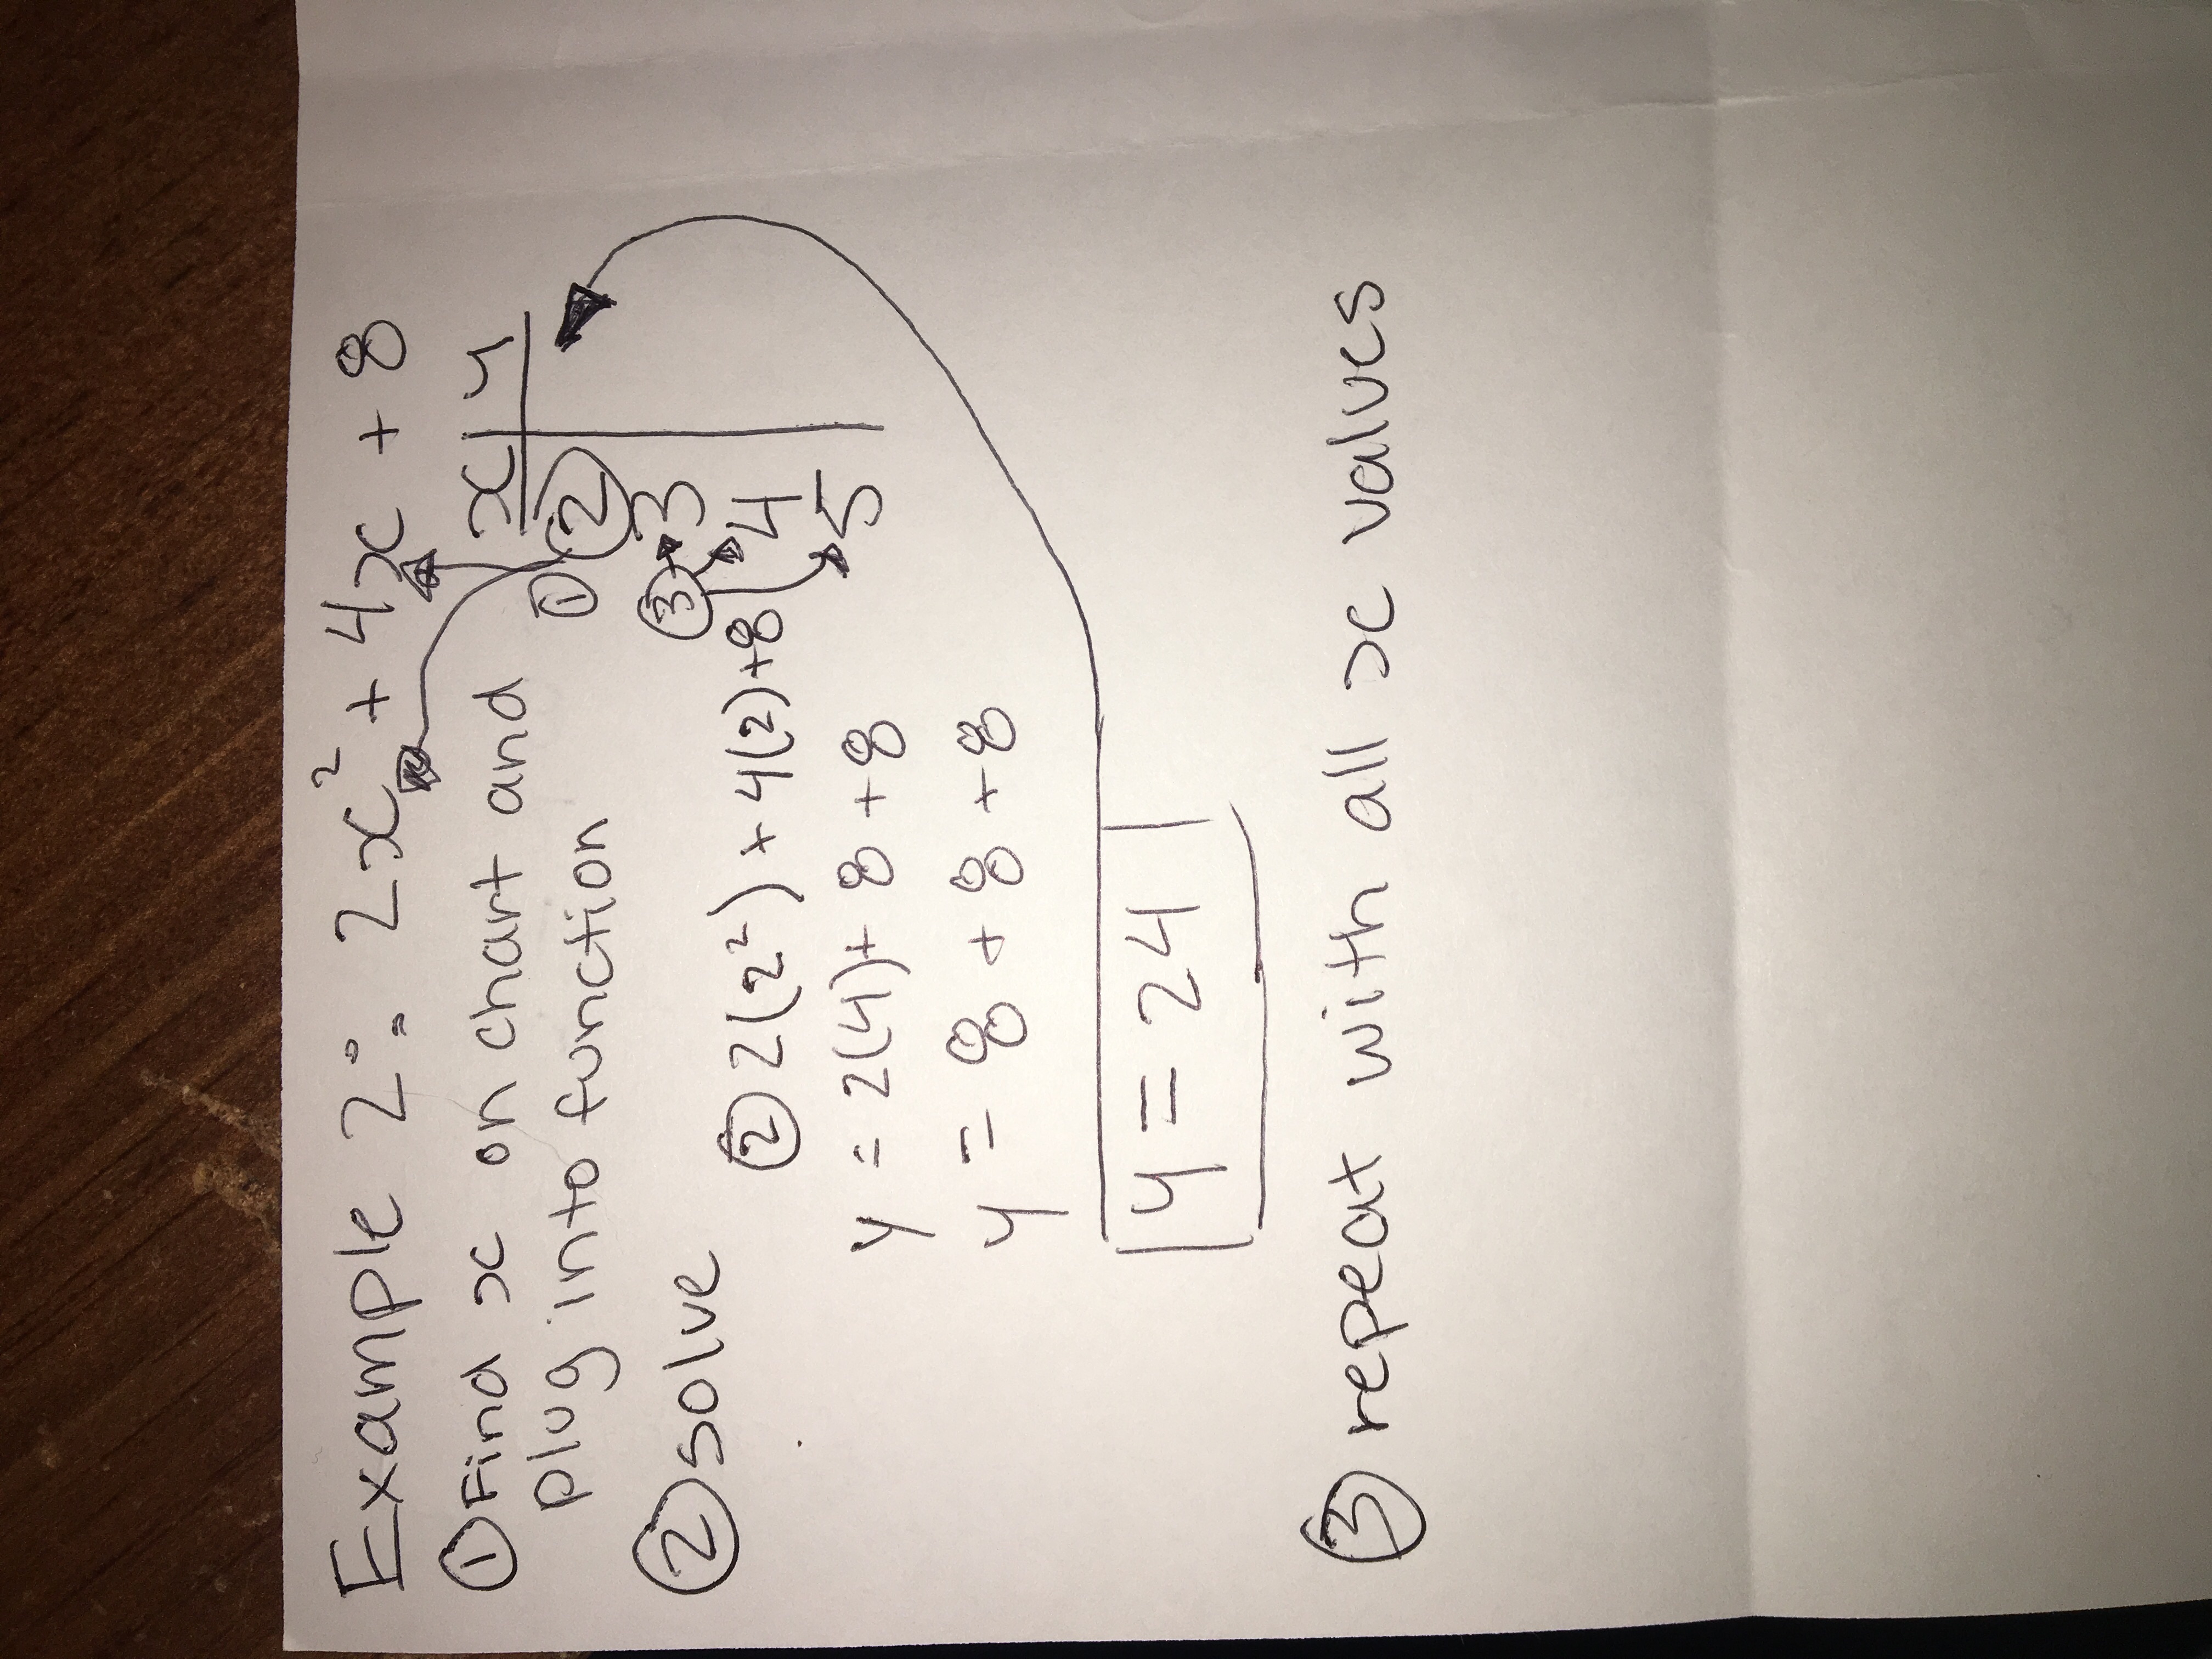
When solving for quadratic functions, you should remember that the x intercept is always equal to y=0 and the y intercept is equal to x=0 (when solving). To find y you simply plug x into the given quadratic function. Below are some examples to visualize how I would solve for y using the table of values and quadratic function.