Week 12 in Precalculus
this week in Precalc I learned how to graph linear inequalities that contain 2 variables. Solutions to a liberal equation with 2 variables is represented by a boundary line and shading in one side.
A solid line for an inequality:

A broken line for an inequality:

to graph it you take the line and convert it to y=mx+b form. Things to look for in this form is the: Y-intercept so you have a point to start from, the X coefficient so you know the rise over run, and the inequality sign to figure out if the boundary line will be solid or broken.

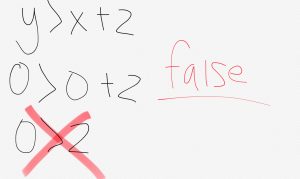
Once you’ve graphed the equation, choose a test point. You can choose any point and plug it into the x and y spot. If the equation is proven true after solving, than you shade that section. If not the equation is false and you shade the other section. The two test points I’ll use is (0,0) and (-5,5)

